`colors` argument to `add_trace` is ignored
Dieses Issue hat noch niemand übernommen.
- Vorherrschende Sprache
- R
- Sterne
- 2.7k
- Forks
- 641
- PR-Merge-Kennzahlen
- Keine gemergten PRs in 30 T.
Beschreibung
This code
library(plotly)

x <- seq(1, 10)
y <- x ^ 1.5
color <- c("a", "b", "c", "d", "e",
           "f", "g", "h", "i", "j")

plot_ly(type = "scatter", mode = "markers",
        x = x, y = y,
        color = color,
        colors = "Dark2",
        mode = "markers")
works as expected and produces the following plot:
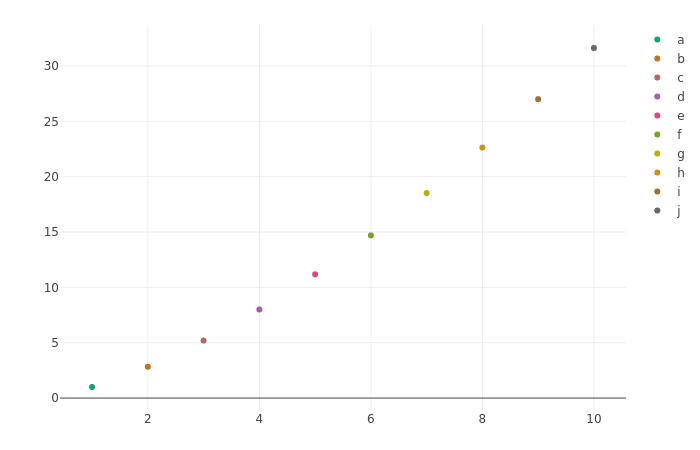
This one:
library(plotly)

x <- seq(1, 10)
y <- x ^ 1.5
color <- c("a", "b", "c", "d", "e",
           "f", "g", "h", "i", "j")

plt <- plot_ly(type = "scatter", mode = "markers")
plt <- add_trace(plt, x = x, y = y,
                 color = color,
                 colors = "Dark2",
                 mode = "markers")
plt
generates the warning
Warning messages:
1: In RColorBrewer::brewer.pal(N, "Set2") :
  n too large, allowed maximum for palette Set2 is 8
Returning the palette you asked for with that many colors

2: In RColorBrewer::brewer.pal(N, "Set2") :
  n too large, allowed maximum for palette Set2 is 8
Returning the palette you asked for with that many colors
and produces the following plot:

The colors argument is ignored.
The same happens when specifying a custom colour palette with colorRampPalette from RColorBrewer:
library(RColorBrewer)
library(plotly)

x <- seq(1, 10)
y <- x ^ 1.5
color <- c("a", "b", "c", "d", "e",
           "f", "g", "h", "i", "j")
colors <- colorRampPalette(brewer.pal(8, "Dark2"))(10)

plt <- plot_ly(type = "scatter", mode = "markers")
plt <- add_trace(plt, x = x, y = y,
                 color = color,
                 colors = colors,
                 mode = "markers")
plt
As far as I can see, this makes it impossible to programmatically build a plot with add_trace and also choose the colour palette at the same time.
Beitragsleitfaden
Erste Schritte
- Lies das ganze Issue und danach den Beitragsleitfaden des Projekts.
- Schreib ins Issue, dass du es übernimmst — das erspart doppelte Arbeit.
- Forke das Repository und arbeite in einem Branch.
- Öffne einen Pull Request, der die Issue-Nummer nennt.
Rechercherichtung
Beginne damit, die beiden Beispiele zu plot_ly und add_trace im Issue zu reproduzieren, und verfolge anschließend, wie der Einstiegspunkt add_trace mit color und colors umgeht. Erledigt ist es, wenn add_trace sowohl die benannte Palette als auch die benutzerdefinierte Ausgabe von colorRampPalette berücksichtigt, ohne die gemeldete Palettenwarnung auszugeben.
Vom Indexierungsmodell aus dem Issue-Text verfasst.
Bewertung
- Tech-Stack
- r
- Bereich
- data-visualization
- Issue-Typ
- Bug
- Schwierigkeit
- 3/5
- Geschätzter Aufwand
- 1-2 Tage
- Aktivitätsstatus
- Veraltet
- Klarheit
- Größtenteils klar
- Anfängerfreundlichkeit
- 45/100