Sankey labels appear at strange locations
Chưa có ai nhận issue này.
- Ngôn ngữ chính
- R
- Star
- 2.7k
- Fork
- 641
- Chỉ số merge pull request
- Không có pull request nào được merge trong 30 ngày
Mô tả
In vertical sankeys, mouseover labels of flows appear at strange locations, some of them outside the drawing area.
See here:
library(plotly)
library(rjson)

json_file <- "https://raw.githubusercontent.com/plotly/plotly.js/master/test/image/mocks/sankey_energy.json"
json_data <- fromJSON(paste(readLines(json_file), collapse=""))

p <- plot_ly(
  type = "sankey",
  domain = list(
    x =  c(0,1),
    y =  c(0,1)
  ),
  orientation = "v", # this is the only change to the original example
  valueformat = ".0f",
  valuesuffix = "TWh",

  node = list(
    label = json_data$data[[1]]$node$label,
    color = json_data$data[[1]]$node$color,
    pad = 15,
    thickness = 15,
    line = list(
      color = "black",
      width = 0.5
    )
  ),

  link = list(
    source = json_data$data[[1]]$link$source,
    target = json_data$data[[1]]$link$target,
    value =  json_data$data[[1]]$link$value,
    label =  json_data$data[[1]]$link$label
  )
) %>%
  layout(
    title = "Energy forecast for 2050<br>Source: Department of Energy & Climate Change, Tom Counsell via <a href='https://bost.ocks.org/mike/sankey/'>Mike Bostock</a>",
    font = list(
      size = 10
    ),
    xaxis = list(showgrid = F, zeroline = F),
    yaxis = list(showgrid = F, zeroline = F)
  )
Result:
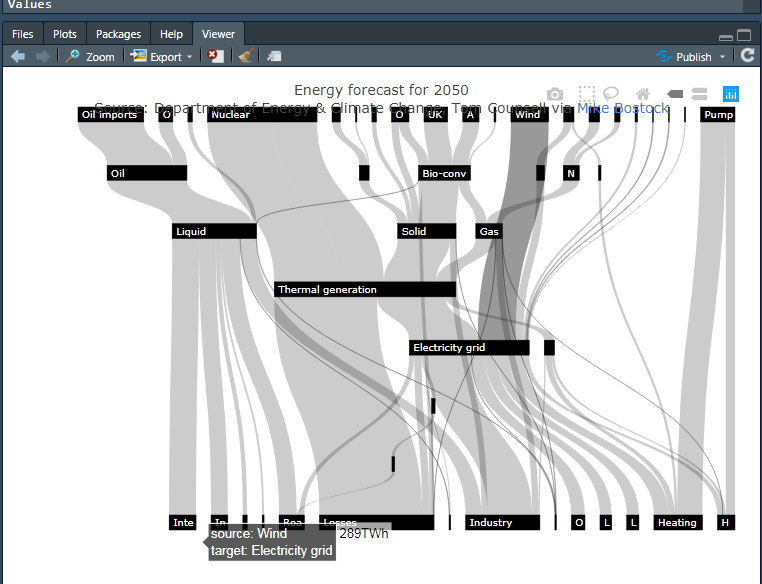
This is the mouseover of the flow currently shaded in dark grey. In general, labels of flows to the left of the plot appear at rather correct locations and labels of flows to the right of the plot are off or do not display at all.
> version
               _
platform       x86_64-w64-mingw32
arch           x86_64
os             mingw32
system         x86_64, mingw32
status
major          3
minor          6.1
year           2019
month          07
day            05
svn rev        76782
language       R
version.string R version 3.6.1 (2019-07-05)
nickname       Action of the Toes

> packageVersion("plotly")
[1] ‘4.9.1’
Hướng dẫn đóng góp
Bắt đầu từ đâu
- Đọc hết issue, rồi đọc hướng dẫn đóng góp của dự án.
- Bình luận trên issue rằng bạn sẽ nhận — tránh hai người làm cùng một việc.
- Fork repository và làm thay đổi trên một nhánh.
- Mở pull request có tham chiếu số hiệu của issue.
Hướng nghiên cứu
Bắt đầu bằng cách chạy ví dụ Sankey R plot_ly được cung cấp với hướng dọc và so sánh các nhãn hover trên toàn bộ vùng vẽ. Truy tìm điểm vào của việc định vị nhãn hover của luồng Sankey và xác minh rằng các nhãn vẫn căn chỉnh với luồng tương ứng, bao gồm cả các liên kết ở bên phải; thêm hoặc chạy một kiểm tra hồi quy nếu tìm thấy vị trí kiểm thử liên quan.
Do mô hình lập chỉ mục viết ra từ nội dung của issue.
Đánh giá
- Công nghệ
- plotly, r
- Lĩnh vực
- data-visualization
- Loại issue
- Lỗi
- Độ khó
- 4/5
- Thời gian dự kiến
- 3-5 ngày
- Mức độ hoạt động
- Đình trệ
- Độ rõ ràng
- Khá rõ ràng
- Mức phù hợp với người mới
- 35/100