Sankey labels appear at strange locations
オープン
まだ誰も着手していません。
- 主要言語
- R
- スター
- 2.7k
- フォーク
- 641
- PR マージ指標
- 30日以内にマージされた PR はありません
説明
In vertical sankeys, mouseover labels of flows appear at strange locations, some of them outside the drawing area.
See here:
library(plotly)
library(rjson)

json_file <- "https://raw.githubusercontent.com/plotly/plotly.js/master/test/image/mocks/sankey_energy.json"
json_data <- fromJSON(paste(readLines(json_file), collapse=""))

p <- plot_ly(
  type = "sankey",
  domain = list(
    x =  c(0,1),
    y =  c(0,1)
  ),
  orientation = "v", # this is the only change to the original example
  valueformat = ".0f",
  valuesuffix = "TWh",

  node = list(
    label = json_data$data[[1]]$node$label,
    color = json_data$data[[1]]$node$color,
    pad = 15,
    thickness = 15,
    line = list(
      color = "black",
      width = 0.5
    )
  ),

  link = list(
    source = json_data$data[[1]]$link$source,
    target = json_data$data[[1]]$link$target,
    value =  json_data$data[[1]]$link$value,
    label =  json_data$data[[1]]$link$label
  )
) %>%
  layout(
    title = "Energy forecast for 2050<br>Source: Department of Energy & Climate Change, Tom Counsell via <a href='https://bost.ocks.org/mike/sankey/'>Mike Bostock</a>",
    font = list(
      size = 10
    ),
    xaxis = list(showgrid = F, zeroline = F),
    yaxis = list(showgrid = F, zeroline = F)
  )
Result:
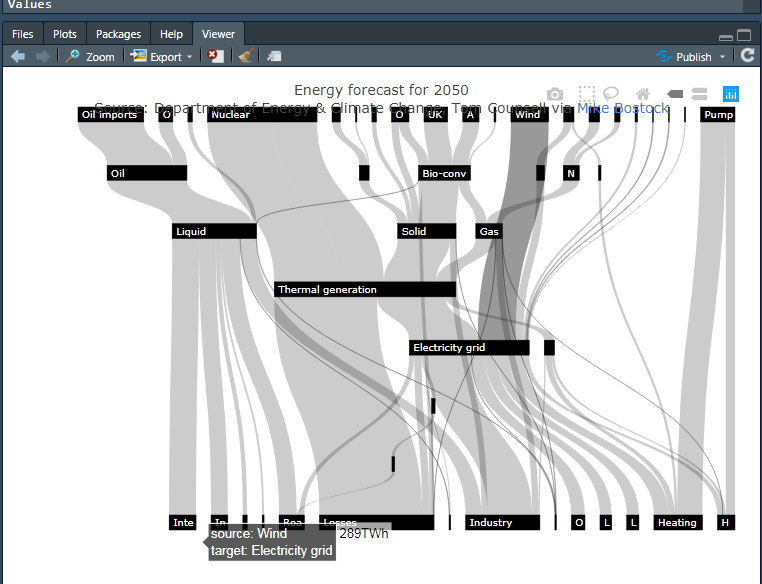
This is the mouseover of the flow currently shaded in dark grey. In general, labels of flows to the left of the plot appear at rather correct locations and labels of flows to the right of the plot are off or do not display at all.
> version
               _
platform       x86_64-w64-mingw32
arch           x86_64
os             mingw32
system         x86_64, mingw32
status
major          3
minor          6.1
year           2019
month          07
day            05
svn rev        76782
language       R
version.string R version 3.6.1 (2019-07-05)
nickname       Action of the Toes

> packageVersion("plotly")
[1] ‘4.9.1’
コントリビューションガイド
はじめの一歩
- issue を最後まで読み、次にプロジェクトのコントリビューションガイドを読みます。
- 着手することを issue にコメントします — 二人が同じ作業をするのを防げます。
- リポジトリをフォークし、ブランチを切って変更します。
- issue 番号を参照したプルリクエストを送ります。
調査の方向性
まず、垂直方向の配置で提供されている R plot_ly Sankey の例を実行し、描画領域全体でホバーラベルを比較します。Sankey フローのホバーラベル配置のエントリポイントを追跡し、右側のリンクを含め、ラベルがそれぞれのフローと揃ったままになっていることを確認します。該当するテスト箇所が見つかった場合は、回帰チェックを追加するか実行します。
索引モデルが issue の本文から書いたものです。
評価
- 技術スタック
- plotly, r
- 領域
- data-visualization
- issue の種類
- バグ
- 難易度
- 4/5
- 見積もり時間
- 3〜5日
- 活発さ
- 停滞
- 明瞭さ
- おおむね明確
- 初心者へのやさしさ
- 35/100