Sankey labels appear at strange locations
Dieses Issue hat noch niemand übernommen.
- Vorherrschende Sprache
- R
- Sterne
- 2.7k
- Forks
- 641
- PR-Merge-Kennzahlen
- Keine gemergten PRs in 30 T.
Beschreibung
In vertical sankeys, mouseover labels of flows appear at strange locations, some of them outside the drawing area.
See here:
library(plotly)
library(rjson)

json_file <- "https://raw.githubusercontent.com/plotly/plotly.js/master/test/image/mocks/sankey_energy.json"
json_data <- fromJSON(paste(readLines(json_file), collapse=""))

p <- plot_ly(
  type = "sankey",
  domain = list(
    x =  c(0,1),
    y =  c(0,1)
  ),
  orientation = "v", # this is the only change to the original example
  valueformat = ".0f",
  valuesuffix = "TWh",

  node = list(
    label = json_data$data[[1]]$node$label,
    color = json_data$data[[1]]$node$color,
    pad = 15,
    thickness = 15,
    line = list(
      color = "black",
      width = 0.5
    )
  ),

  link = list(
    source = json_data$data[[1]]$link$source,
    target = json_data$data[[1]]$link$target,
    value =  json_data$data[[1]]$link$value,
    label =  json_data$data[[1]]$link$label
  )
) %>%
  layout(
    title = "Energy forecast for 2050<br>Source: Department of Energy & Climate Change, Tom Counsell via <a href='https://bost.ocks.org/mike/sankey/'>Mike Bostock</a>",
    font = list(
      size = 10
    ),
    xaxis = list(showgrid = F, zeroline = F),
    yaxis = list(showgrid = F, zeroline = F)
  )
Result:
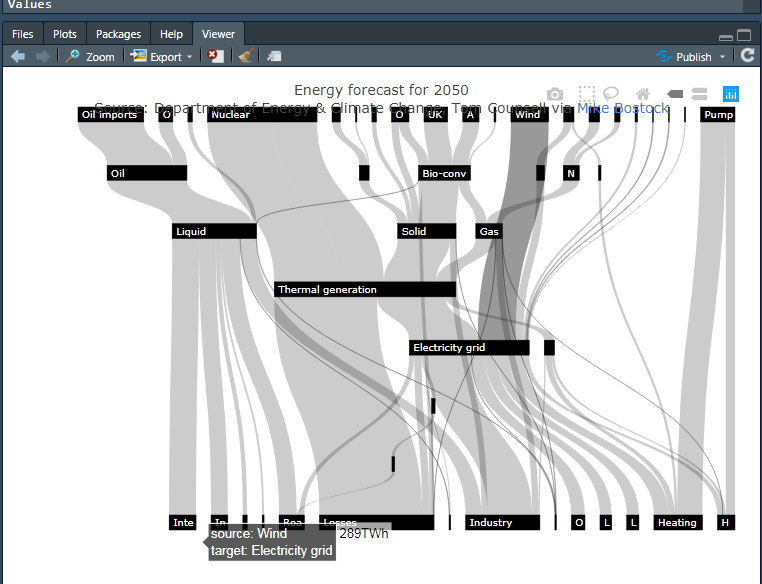
This is the mouseover of the flow currently shaded in dark grey. In general, labels of flows to the left of the plot appear at rather correct locations and labels of flows to the right of the plot are off or do not display at all.
> version
               _
platform       x86_64-w64-mingw32
arch           x86_64
os             mingw32
system         x86_64, mingw32
status
major          3
minor          6.1
year           2019
month          07
day            05
svn rev        76782
language       R
version.string R version 3.6.1 (2019-07-05)
nickname       Action of the Toes

> packageVersion("plotly")
[1] ‘4.9.1’
Beitragsleitfaden
Erste Schritte
- Lies das ganze Issue und danach den Beitragsleitfaden des Projekts.
- Schreib ins Issue, dass du es übernimmst — das erspart doppelte Arbeit.
- Forke das Repository und arbeite in einem Branch.
- Öffne einen Pull Request, der die Issue-Nummer nennt.
Rechercherichtung
Beginne damit, das bereitgestellte R plot_ly Sankey-Beispiel mit vertikaler Ausrichtung auszuführen, und vergleiche die Hover-Beschriftungen über den gesamten Zeichenbereich hinweg. Verfolge den Einstiegspunkt für die Positionierung der Sankey-Flow-Hover-Beschriftungen und überprüfe, dass die Beschriftungen weiterhin an ihren Flows ausgerichtet bleiben, einschließlich der Links auf der rechten Seite; füge eine Regressionprüfung hinzu oder führe eine solche aus, falls der relevante Teststandort gefunden wird.
Vom Indexierungsmodell aus dem Issue-Text verfasst.
Bewertung
- Tech-Stack
- plotly, r
- Bereich
- data-visualization
- Issue-Typ
- Bug
- Schwierigkeit
- 4/5
- Geschätzter Aufwand
- 3-5 Tage
- Aktivitätsstatus
- Veraltet
- Klarheit
- Größtenteils klar
- Anfängerfreundlichkeit
- 35/100