Sankey labels appear at strange locations
Nessuno ha ancora preso questa issue.
- Lingua principale
- R
- Stelle
- 2.7k
- Fork
- 641
- Metriche di merge delle PR
- Nessuna PR unita negli ultimi 30g
Descrizione
In vertical sankeys, mouseover labels of flows appear at strange locations, some of them outside the drawing area.
See here:
library(plotly)
library(rjson)

json_file <- "https://raw.githubusercontent.com/plotly/plotly.js/master/test/image/mocks/sankey_energy.json"
json_data <- fromJSON(paste(readLines(json_file), collapse=""))

p <- plot_ly(
  type = "sankey",
  domain = list(
    x =  c(0,1),
    y =  c(0,1)
  ),
  orientation = "v", # this is the only change to the original example
  valueformat = ".0f",
  valuesuffix = "TWh",

  node = list(
    label = json_data$data[[1]]$node$label,
    color = json_data$data[[1]]$node$color,
    pad = 15,
    thickness = 15,
    line = list(
      color = "black",
      width = 0.5
    )
  ),

  link = list(
    source = json_data$data[[1]]$link$source,
    target = json_data$data[[1]]$link$target,
    value =  json_data$data[[1]]$link$value,
    label =  json_data$data[[1]]$link$label
  )
) %>%
  layout(
    title = "Energy forecast for 2050<br>Source: Department of Energy & Climate Change, Tom Counsell via <a href='https://bost.ocks.org/mike/sankey/'>Mike Bostock</a>",
    font = list(
      size = 10
    ),
    xaxis = list(showgrid = F, zeroline = F),
    yaxis = list(showgrid = F, zeroline = F)
  )
Result:
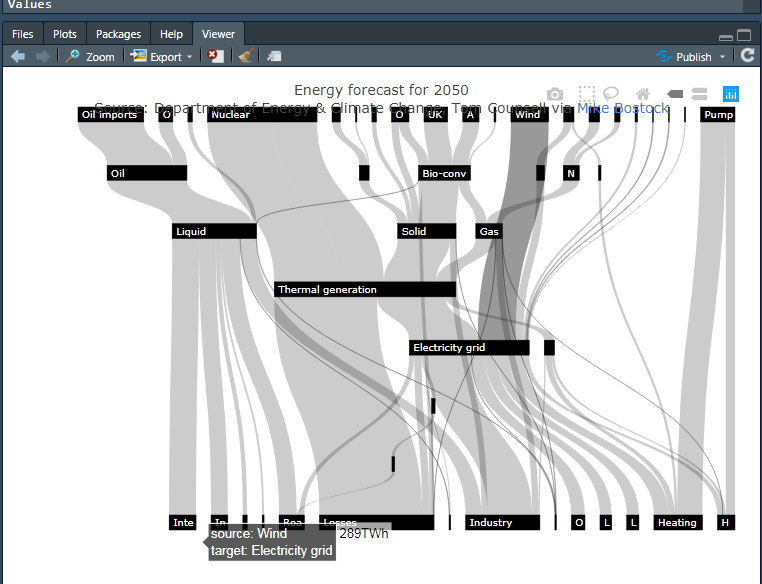
This is the mouseover of the flow currently shaded in dark grey. In general, labels of flows to the left of the plot appear at rather correct locations and labels of flows to the right of the plot are off or do not display at all.
> version
               _
platform       x86_64-w64-mingw32
arch           x86_64
os             mingw32
system         x86_64, mingw32
status
major          3
minor          6.1
year           2019
month          07
day            05
svn rev        76782
language       R
version.string R version 3.6.1 (2019-07-05)
nickname       Action of the Toes

> packageVersion("plotly")
[1] ‘4.9.1’
Guida per i contributori
Apri la guida per i contributori
Come iniziare
- Leggi tutta la issue e poi la guida ai contributi del progetto.
- Commenta sulla issue per dire che te ne occupi tu — evita che due persone facciano lo stesso lavoro.
- Fai un fork del repository e lavora su un branch.
- Apri una pull request che faccia riferimento al numero della issue.
Direzione di ricerca
Inizia eseguendo l’esempio Sankey fornito di R plot_ly con orientamento verticale e confronta le etichette al passaggio del mouse in tutta l’area di disegno. Traccia il punto di ingresso del posizionamento delle etichette al passaggio del mouse dei flussi Sankey e verifica che le etichette rimangano allineate con i relativi flussi, inclusi i link a destra; aggiungi o esegui un controllo di regressione se viene trovata la posizione del test pertinente.
Scritto dal modello di indicizzazione a partire dal testo della issue.
Valutazione
- Stack tecnologico
- plotly, r
- Ambito
- data-visualization
- Tipo di issue
- Bug
- Difficoltà
- 4/5
- Tempo stimato
- 3-5 giorni
- Stato di attività
- Ferma
- Chiarezza
- Abbastanza chiara
- Idoneità per principianti
- 35/100