matplotlib / matplotlib/ipympl
"Transform()" returns bad coordinates with ipympl
Chưa có ai nhận issue này.
- Ngôn ngữ chính
- Jupyter Notebook
- Star
- 1.7k
- Fork
- 234
- Chỉ số merge pull request
- Không có pull request nào được merge trong 30 ngày
Mô tả
## Describe the issue
I believe the "transform()" functions of Matplotlib do not behave well in ipympl or widget mode.
**Code for reproduction**
I simply use the matplotlib example published here:
https://matplotlib.org/3.1.1/tutorials/advanced/transforms_tutorial.html
I copy/paste the code for basic help :
```python
import numpy as np
import matplotlib.pyplot as plt
import matplotlib.patches as mpatches
x = np.arange(0, 10, 0.005)
y = np.exp(-x/2.) * np.sin(2*np.pi*x)
fig, ax = plt.subplots()
ax.plot(x, y)
ax.set_xlim(0, 10)
ax.set_ylim(-1, 1)
xdata, ydata = 5, 0
xdisplay, ydisplay = ax.transData.transform_point((xdata, ydata))
bbox = dict(boxstyle="round", fc="0.8")
arrowprops = dict(
arrowstyle="->",
connectionstyle="angle,angleA=0,angleB=90,rad=10")
offset = 72
ax.annotate('data = (%.1f, %.1f)' % (xdata, ydata),
(xdata, ydata), xytext=(-2*offset, offset), textcoords='offset points',
bbox=bbox, arrowprops=arrowprops)
disp = ax.annotate('display = (%.1f, %.1f)' % (xdisplay, ydisplay),
(xdisplay, ydisplay), xytext=(0.5*offset, -offset),
xycoords='figure pixels',
textcoords='offset points',
bbox=bbox, arrowprops=arrowprops)
plt.show()
```
**Actual outcome**
I get different results depending on the matplotlib mode :
- on one side, %matplotlib inline gives the result expected and displayed in the example, as below :
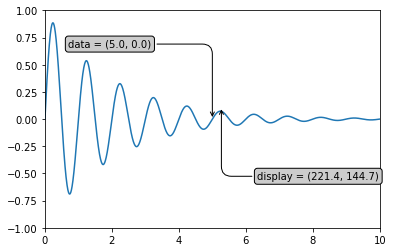
- on the other side, %matplotlib ipympl or %matplotlib widget give erroneous results, as below :

The result is the same if I download with the "floppy-disk" icon of the widget.
**Expected outcome**
The result with widget or ipympl mode should be the one of inline mode.
## Versions
```
3.7.7 (default, Mar 26 2020, 10:32:53)
[Clang 4.0.1 (tags/RELEASE_401/final)]
ipympl version: 0.5.2
jupyter core : 4.6.3
jupyter-notebook : 6.0.3
qtconsole : 4.7.5
ipython : 7.16.1
ipykernel : 5.3.3
jupyter client : 6.1.6
jupyter lab : 1.2.6
nbconvert : 5.6.1
ipywidgets : 7.5.1
nbformat : 5.0.7
traitlets : 4.3.3
Known nbextensions:
config dir: /Users/mmyara/.jupyter/nbconfig
notebook section
jupyter-js-widgets/extension enabled
- Validating: OK
config dir: /opt/miniconda3/etc/jupyter/nbconfig
notebook section
jupyter-matplotlib/extension enabled
- Validating: OK
plotlywidget/extension enabled
- Validating: OK
jupyter-js-widgets/extension enabled
- Validating: OK
tree section
ipyparallel/main enabled
- Validating: OK
JupyterLab v1.2.6
Known labextensions:
app dir: /opt/miniconda3/share/jupyter/lab
@jupyter-widgets/jupyterlab-manager v1.1.0 enabled OK
@jupyterlab/toc v2.0.0 enabled OK
@lckr/jupyterlab_variableinspector v0.4.0 enabled OK
jupyter-matplotlib v0.7.1 enabled OK
jupyterlab-plotly v4.9.0 enabled OK
plotlywidget v4.9.0 enabled OK```
Hướng dẫn đóng góp
Bắt đầu từ đâu
- Đọc hết issue, rồi đọc hướng dẫn đóng góp của dự án.
- Bình luận trên issue rằng bạn sẽ nhận — tránh hai người làm cùng một việc.
- Fork repository và làm thay đổi trên một nhánh.
- Mở pull request có tham chiếu số hiệu của issue.
Hướng nghiên cứu
Bắt đầu bằng cách chạy ví dụ về phép biến đổi Matplotlib được cung cấp ở các chế độ inline và ipympl/widget, sau đó so sánh các kết quả được hiển thị và lưu. Issue hoàn tất khi chế độ widget tạo ra cùng tọa độ và vị trí chú thích như chế độ inline.
Do mô hình lập chỉ mục viết ra từ nội dung của issue.
Đánh giá
- Công nghệ
- jupyter, jupyter-notebook, python
- Lĩnh vực
- frontend, web-dev
- Loại issue
- Lỗi
- Độ khó
- 4/5
- Thời gian dự kiến
- 3-5 ngày
- Mức độ hoạt động
- Đình trệ
- Độ rõ ràng
- Đặc tả rõ ràng
- Mức phù hợp với người mới
- 38/100