matplotlib / matplotlib/ipympl
"Transform()" returns bad coordinates with ipympl
Personne n'a encore pris cette issue.
- Langage dominant
- Jupyter Notebook
- Étoiles
- 1.7k
- Forks
- 234
- Métriques de merge des PR
- Aucune PR mergée en 30 j
Description
Describe the issue
I believe the "transform()" functions of Matplotlib do not behave well in ipympl or widget mode.
Code for reproduction
I simply use the matplotlib example published here:
https://matplotlib.org/3.1.1/tutorials/advanced/transforms_tutorial.html
I copy/paste the code for basic help :
import numpy as np
import matplotlib.pyplot as plt
import matplotlib.patches as mpatches

x = np.arange(0, 10, 0.005)
y = np.exp(-x/2.) * np.sin(2*np.pi*x)

fig, ax = plt.subplots()
ax.plot(x, y)
ax.set_xlim(0, 10)
ax.set_ylim(-1, 1)

xdata, ydata = 5, 0
xdisplay, ydisplay = ax.transData.transform_point((xdata, ydata))

bbox = dict(boxstyle="round", fc="0.8")
arrowprops = dict(
    arrowstyle="->",
    connectionstyle="angle,angleA=0,angleB=90,rad=10")

offset = 72
ax.annotate('data = (%.1f, %.1f)' % (xdata, ydata),
            (xdata, ydata), xytext=(-2*offset, offset), textcoords='offset points',
            bbox=bbox, arrowprops=arrowprops)

disp = ax.annotate('display = (%.1f, %.1f)' % (xdisplay, ydisplay),
                   (xdisplay, ydisplay), xytext=(0.5*offset, -offset),
                   xycoords='figure pixels',
                   textcoords='offset points',
                   bbox=bbox, arrowprops=arrowprops)

plt.show()
Actual outcome
I get different results depending on the matplotlib mode :
- on one side, %matplotlib inline gives the result expected and displayed in the example, as below :
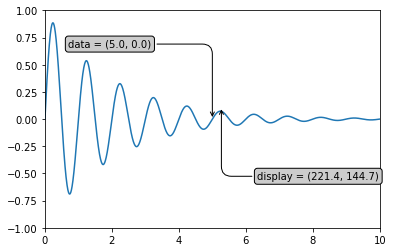
- on the other side, %matplotlib ipympl or %matplotlib widget give erroneous results, as below :
 The result is the same if I download with the "floppy-disk" icon of the widget.
Expected outcome
The result with widget or ipympl mode should be the one of inline mode.
Versions
 3.7.7 (default, Mar 26 2020, 10:32:53)
[Clang 4.0.1 (tags/RELEASE_401/final)]
ipympl version: 0.5.2
jupyter core     : 4.6.3
jupyter-notebook : 6.0.3
qtconsole        : 4.7.5
ipython          : 7.16.1
ipykernel        : 5.3.3
jupyter client   : 6.1.6
jupyter lab      : 1.2.6
nbconvert        : 5.6.1
ipywidgets       : 7.5.1
nbformat         : 5.0.7
traitlets        : 4.3.3
Known nbextensions:
  config dir: /Users/mmyara/.jupyter/nbconfig
    notebook section
      jupyter-js-widgets/extension  enabled
      - Validating: OK
  config dir: /opt/miniconda3/etc/jupyter/nbconfig
    notebook section
      jupyter-matplotlib/extension  enabled
      - Validating: OK
      plotlywidget/extension  enabled
      - Validating: OK
      jupyter-js-widgets/extension  enabled
      - Validating: OK
    tree section
      ipyparallel/main  enabled
      - Validating: OK
JupyterLab v1.2.6
Known labextensions:
   app dir: /opt/miniconda3/share/jupyter/lab
        @jupyter-widgets/jupyterlab-manager v1.1.0  enabled  OK
        @jupyterlab/toc v2.0.0  enabled  OK
        @lckr/jupyterlab_variableinspector v0.4.0  enabled  OK
        jupyter-matplotlib v0.7.1  enabled  OK
        jupyterlab-plotly v4.9.0  enabled  OK
        plotlywidget v4.9.0  enabled  OK```
Guide de contribution
Ouvrir le guide de contribution
Par où commencer
- Lisez l'issue en entier, puis le guide de contribution du projet.
- Signalez en commentaire que vous la prenez — cela évite que deux personnes fassent le même travail.
- Forkez le dépôt et travaillez sur une branche.
- Ouvrez une pull request qui référence le numéro de l'issue.
Piste de recherche
Commencez par exécuter l’exemple de transformation Matplotlib fourni dans les modes inline et ipympl/widget, puis comparez les résultats affichés et enregistrés. L’issue est terminée lorsque le mode widget produit les mêmes coordonnées et le même positionnement des annotations que le mode inline.
Rédigé par le modèle d'indexation à partir du texte de l'issue.
Évaluation
- Stack technique
- jupyter, jupyter-notebook, python
- Domaine
- frontend, web-dev
- Type d'issue
- Bug
- Difficulté
- 4/5
- Temps estimé
- 3-5 jours
- Activité
- À l'abandon
- Clarté
- Clairement spécifiée
- Accessibilité débutants
- 38/100