matplotlib / matplotlib/ipympl
"Transform()" returns bad coordinates with ipympl
Nadie ha tomado este issue todavía.
- Lenguaje dominante
- Jupyter Notebook
- Estrellas
- 1.7k
- Forks
- 234
- Métricas de merge de PR
- Sin PR fusionados en 30 d
Descripción
## Describe the issue
I believe the "transform()" functions of Matplotlib do not behave well in ipympl or widget mode.
**Code for reproduction**
I simply use the matplotlib example published here:
https://matplotlib.org/3.1.1/tutorials/advanced/transforms_tutorial.html
I copy/paste the code for basic help :
```python
import numpy as np
import matplotlib.pyplot as plt
import matplotlib.patches as mpatches
x = np.arange(0, 10, 0.005)
y = np.exp(-x/2.) * np.sin(2*np.pi*x)
fig, ax = plt.subplots()
ax.plot(x, y)
ax.set_xlim(0, 10)
ax.set_ylim(-1, 1)
xdata, ydata = 5, 0
xdisplay, ydisplay = ax.transData.transform_point((xdata, ydata))
bbox = dict(boxstyle="round", fc="0.8")
arrowprops = dict(
arrowstyle="->",
connectionstyle="angle,angleA=0,angleB=90,rad=10")
offset = 72
ax.annotate('data = (%.1f, %.1f)' % (xdata, ydata),
(xdata, ydata), xytext=(-2*offset, offset), textcoords='offset points',
bbox=bbox, arrowprops=arrowprops)
disp = ax.annotate('display = (%.1f, %.1f)' % (xdisplay, ydisplay),
(xdisplay, ydisplay), xytext=(0.5*offset, -offset),
xycoords='figure pixels',
textcoords='offset points',
bbox=bbox, arrowprops=arrowprops)
plt.show()
```
**Actual outcome**
I get different results depending on the matplotlib mode :
- on one side, %matplotlib inline gives the result expected and displayed in the example, as below :
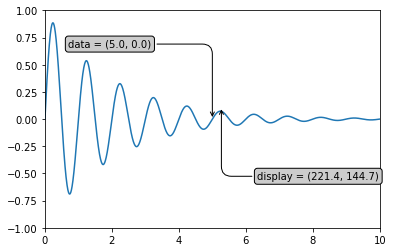
- on the other side, %matplotlib ipympl or %matplotlib widget give erroneous results, as below :

The result is the same if I download with the "floppy-disk" icon of the widget.
**Expected outcome**
The result with widget or ipympl mode should be the one of inline mode.
## Versions
```
3.7.7 (default, Mar 26 2020, 10:32:53)
[Clang 4.0.1 (tags/RELEASE_401/final)]
ipympl version: 0.5.2
jupyter core : 4.6.3
jupyter-notebook : 6.0.3
qtconsole : 4.7.5
ipython : 7.16.1
ipykernel : 5.3.3
jupyter client : 6.1.6
jupyter lab : 1.2.6
nbconvert : 5.6.1
ipywidgets : 7.5.1
nbformat : 5.0.7
traitlets : 4.3.3
Known nbextensions:
config dir: /Users/mmyara/.jupyter/nbconfig
notebook section
jupyter-js-widgets/extension enabled
- Validating: OK
config dir: /opt/miniconda3/etc/jupyter/nbconfig
notebook section
jupyter-matplotlib/extension enabled
- Validating: OK
plotlywidget/extension enabled
- Validating: OK
jupyter-js-widgets/extension enabled
- Validating: OK
tree section
ipyparallel/main enabled
- Validating: OK
JupyterLab v1.2.6
Known labextensions:
app dir: /opt/miniconda3/share/jupyter/lab
@jupyter-widgets/jupyterlab-manager v1.1.0 enabled OK
@jupyterlab/toc v2.0.0 enabled OK
@lckr/jupyterlab_variableinspector v0.4.0 enabled OK
jupyter-matplotlib v0.7.1 enabled OK
jupyterlab-plotly v4.9.0 enabled OK
plotlywidget v4.9.0 enabled OK```
Guía de contribución
Primeros pasos
- Lee el issue completo y luego la guía de contribución del proyecto.
- Comenta en el issue que vas a ocuparte — evita que dos personas hagan lo mismo.
- Haz un fork del repositorio y trabaja en una rama.
- Abre un pull request que haga referencia al número del issue.
Línea de trabajo
Comienza ejecutando el ejemplo de transformación de Matplotlib proporcionado en los modos inline e ipympl/widget y, a continuación, compara los resultados mostrados y guardados. El issue estará terminado cuando el modo widget produzca las mismas coordenadas y la misma colocación de las anotaciones que el modo inline.
Escrito por el modelo de indexación a partir del texto del issue.
Evaluación
- Stack tecnológico
- jupyter, jupyter-notebook, python
- Área
- frontend, web-dev
- Tipo de issue
- Error
- Dificultad
- 4/5
- Tiempo estimado
- 3-5 días
- Estado de actividad
- Estancado
- Claridad
- Bien especificado
- Aptitud para principiantes
- 38/100