matplotlib / matplotlib/ipympl
figures that start in background tabs are cut off at bottom
まだ誰も着手していません。
- 主要言語
- Jupyter Notebook
- スター
- 1.7k
- フォーク
- 234
- PR マージ指標
- 30日以内にマージされた PR はありません
説明
I'm having some trouble with figures getting cut off at the bottom when they're included in tabs other than the first tab. Here's a minimal example. Note that I put the figures in boxes because I have the same problem as #126 if I don't.
```
%matplotlib widget
import matplotlib.pyplot as plt
plt.ioff()
import ipywidgets as widgets
import numpy as np
fig1,ax1 = plt.subplots()
ax1.scatter(np.arange(10),np.random.random(10))
ax1.set_xlabel('x axis')
ax1.set_ylabel('y axis')
fig2,ax2 = plt.subplots()
ax2.plot(np.arange(10),np.random.random(10))
ax2.set_xlabel('x axis')
ax2.set_ylabel('y axis')
tabs = widgets.Tab(children=[widgets.Box([fig1.canvas]),widgets.Box([fig2.canvas])])
tabs.set_title(0, 'fig1')
tabs.set_title(1, 'fig2')
tabs
```
The first tab looks like (I clicked on the figure to show the boundaries)

and the second tab looks like:
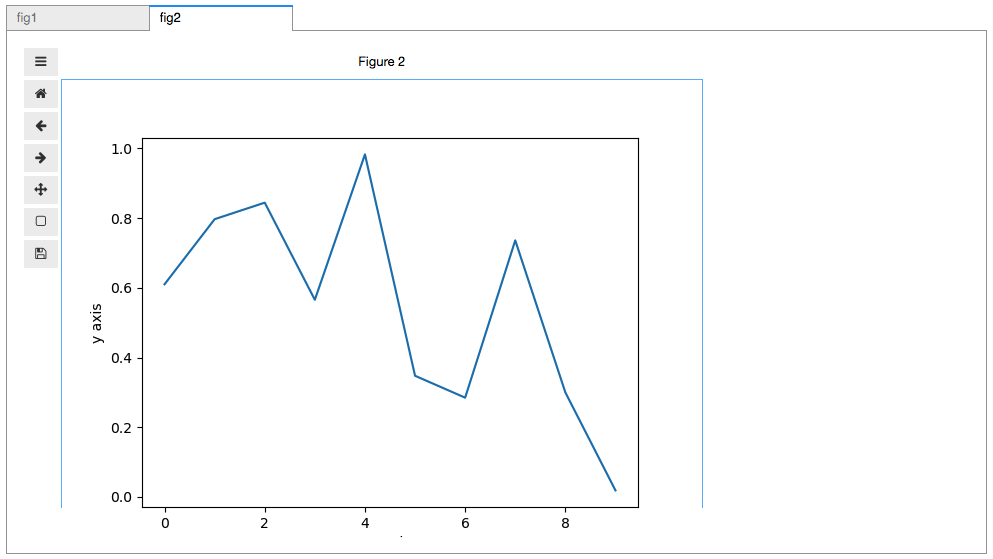
I just cannot figure out why the bottom of that second figure is getting cut off.
コントリビューションガイド
はじめの一歩
- issue を最後まで読み、次にプロジェクトのコントリビューションガイドを読みます。
- 着手することを issue にコメントします — 二人が同じ作業をするのを防げます。
- リポジトリをフォークし、ブランチを切って変更します。
- issue 番号を参照したプルリクエストを送ります。
調査の方向性
まず、2つの ipywidgets タブと matplotlib の Figure を使った最小限の notebook 例を実行し、最初は非表示になっている2つ目の Figure のサイズを1つ目と比較します。2つ目のタブが表示されたときに、Figure の寸法がどのように決定されるかを追跡します。すべてのタブの Figure で、プロット領域全体が切り取られずに表示されれば完了です。
索引モデルが issue の本文から書いたものです。
評価
- 技術スタック
- jupyter, jupyter-notebook, python
- 領域
- data-visualization, frontend
- issue の種類
- バグ
- 難易度
- 3/5
- 見積もり時間
- 1〜2日
- 活発さ
- 停滞
- 明瞭さ
- おおむね明確
- 初心者へのやさしさ
- 45/100