matplotlib / matplotlib/ipympl
figures that start in background tabs are cut off at bottom
Dieses Issue hat noch niemand übernommen.
- Vorherrschende Sprache
- Jupyter Notebook
- Sterne
- 1.7k
- Forks
- 234
- PR-Merge-Kennzahlen
- Keine gemergten PRs in 30 T.
Beschreibung
I'm having some trouble with figures getting cut off at the bottom when they're included in tabs other than the first tab. Here's a minimal example. Note that I put the figures in boxes because I have the same problem as #126 if I don't.
```
%matplotlib widget
import matplotlib.pyplot as plt
plt.ioff()
import ipywidgets as widgets
import numpy as np
fig1,ax1 = plt.subplots()
ax1.scatter(np.arange(10),np.random.random(10))
ax1.set_xlabel('x axis')
ax1.set_ylabel('y axis')
fig2,ax2 = plt.subplots()
ax2.plot(np.arange(10),np.random.random(10))
ax2.set_xlabel('x axis')
ax2.set_ylabel('y axis')
tabs = widgets.Tab(children=[widgets.Box([fig1.canvas]),widgets.Box([fig2.canvas])])
tabs.set_title(0, 'fig1')
tabs.set_title(1, 'fig2')
tabs
```
The first tab looks like (I clicked on the figure to show the boundaries)

and the second tab looks like:
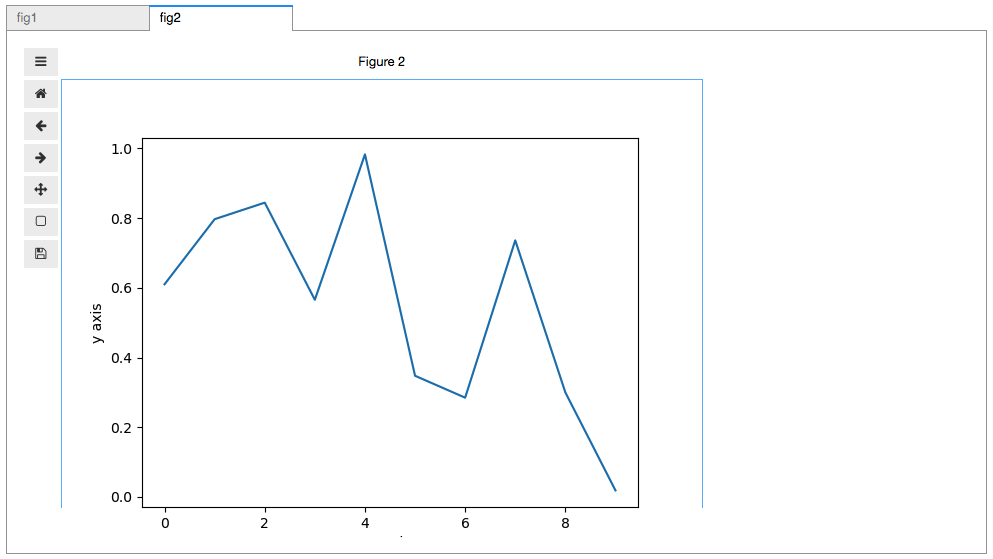
I just cannot figure out why the bottom of that second figure is getting cut off.
Beitragsleitfaden
Erste Schritte
- Lies das ganze Issue und danach den Beitragsleitfaden des Projekts.
- Schreib ins Issue, dass du es übernimmst — das erspart doppelte Arbeit.
- Forke das Repository und arbeite in einem Branch.
- Öffne einen Pull Request, der die Issue-Nummer nennt.
Rechercherichtung
Beginnen Sie damit, das minimale Notebook-Beispiel mit zwei ipywidgets-Tabs und matplotlib-Abbildungen auszuführen, und vergleichen Sie dann die Größe der zunächst ausgeblendeten zweiten Abbildung mit der ersten. Verfolgen Sie, wie die Abmessungen der Abbildung festgelegt werden, wenn der zweite Tab sichtbar wird. Als abgeschlossen gilt die Aufgabe, wenn die Abbildungen in jedem Tab ihren vollständigen Plotbereich anzeigen, ohne abgeschnitten zu werden.
Vom Indexierungsmodell aus dem Issue-Text verfasst.
Bewertung
- Tech-Stack
- jupyter, jupyter-notebook, python
- Bereich
- data-visualization, frontend
- Issue-Typ
- Bug
- Schwierigkeit
- 3/5
- Geschätzter Aufwand
- 1-2 Tage
- Aktivitätsstatus
- Veraltet
- Klarheit
- Größtenteils klar
- Anfängerfreundlichkeit
- 45/100