matplotlib / matplotlib/ipympl
figures that start in background tabs are cut off at bottom
未关闭
还没有人认领这个 Issue。
- 主要语言
- Jupyter Notebook
- 星标
- 1.7k
- 派生
- 234
- PR 合并指标
- 30 天内没有已合并 PR
描述
I'm having some trouble with figures getting cut off at the bottom when they're included in tabs other than the first tab. Here's a minimal example. Note that I put the figures in boxes because I have the same problem as #126 if I don't.
%matplotlib widget
import matplotlib.pyplot as plt
plt.ioff()
import ipywidgets as widgets
import numpy as np
fig1,ax1 = plt.subplots()
ax1.scatter(np.arange(10),np.random.random(10))
ax1.set_xlabel('x axis')
ax1.set_ylabel('y axis')
fig2,ax2 = plt.subplots()
ax2.plot(np.arange(10),np.random.random(10))
ax2.set_xlabel('x axis')
ax2.set_ylabel('y axis')
tabs = widgets.Tab(children=[widgets.Box([fig1.canvas]),widgets.Box([fig2.canvas])])
tabs.set_title(0, 'fig1')
tabs.set_title(1, 'fig2')
tabs
The first tab looks like (I clicked on the figure to show the boundaries)

and the second tab looks like:
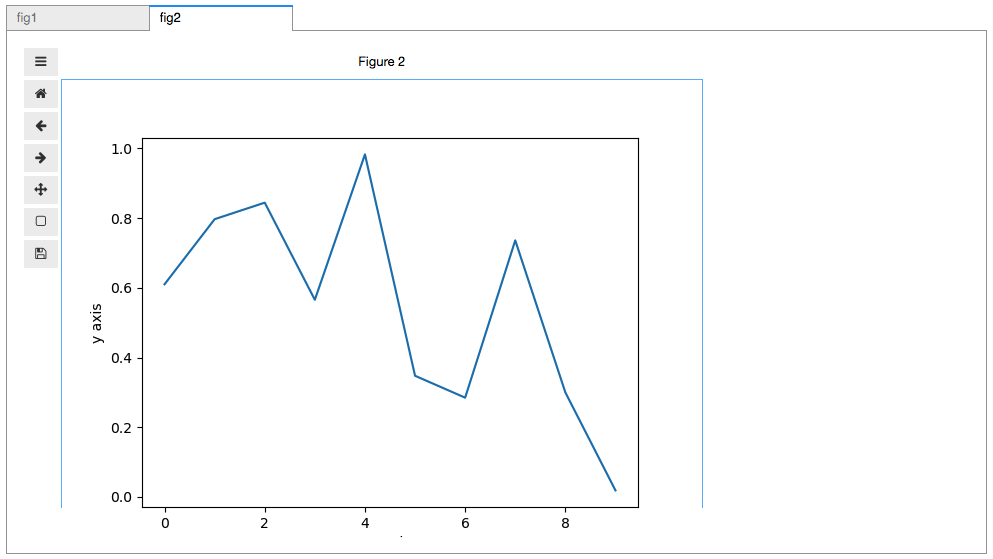
I just cannot figure out why the bottom of that second figure is getting cut off.
贡献指南
从这里开始
- 先读完整个 Issue,再读项目的贡献指南。
- 在 Issue 下留言说明你要接手 —— 这能避免两个人做同样的事。
- Fork 仓库,在一个分支上完成修改。
- 提交 Pull Request,并在描述里引用这个 Issue 编号。
调研方向
首先运行包含两个 ipywidgets 选项卡和 matplotlib 图形的最小 notebook 示例,然后比较最初隐藏的第二个图形与第一个图形的大小。跟踪第二个选项卡变为可见时图形尺寸是如何确定的。完成标准是每个选项卡中的图形都能显示完整的绘图区,且不会被截断。
由索引模型根据 Issue 内容生成。
评估
- 技术栈
- jupyter, jupyter-notebook, python
- 领域
- data-visualization, frontend
- Issue 类型
- 缺陷
- 难度
- 3/5
- 预计耗时
- 1-2 天
- 活跃度
- 停滞
- 描述清晰度
- 基本清楚
- 新手友好度
- 45/100