plotly / plotly/react-plotly.js
There are no properties to use when using typeScript.
オープン
まだ誰も着手していません。
- 主要言語
- JavaScript
- スター
- 1.1k
- フォーク
- 138
- 平均マージ
- 3日 2時間
- マージ済み PR(30日)
- 4
説明
When using histogram charts, there are xbins properties but no ybins properties.
data={[
          {
            type: 'histogram',
            text: chartText,
            histfunc: 'sum',
            x,
            y,
            ybins: {
              start: y[y.length - 6],
              end: y[y.length - 1],
              size: 1
            }
          }
        ]}
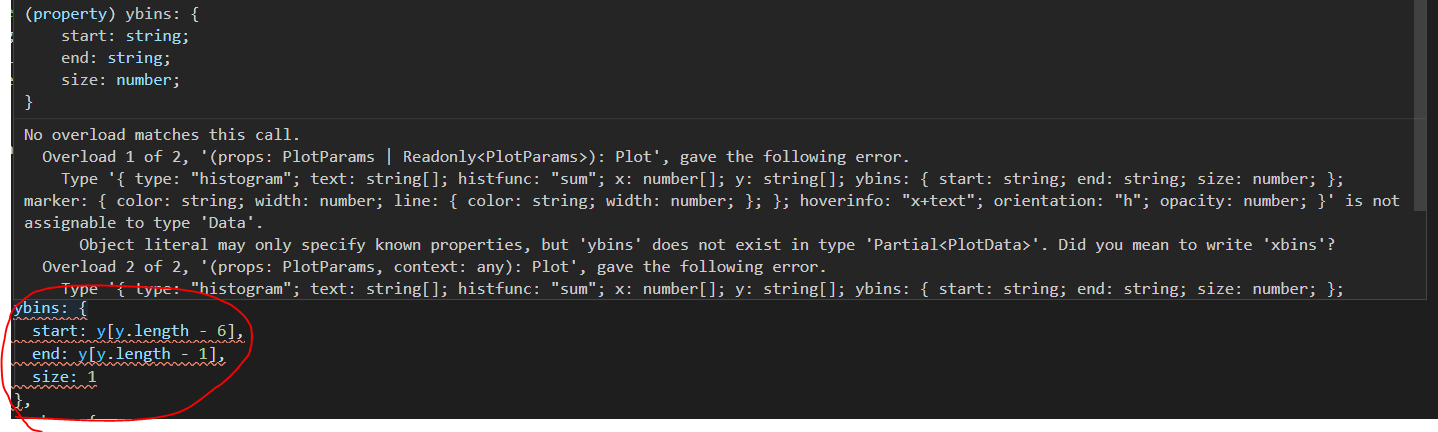
data={[
          {
            type: 'histogram',
            text: chartText,
            histfunc: 'sum',
            x,
            y,
            ybins: {
              start: y[y.length - 6],
              end: y[y.length - 1],
              size: 1
            }
          } as Data
        ]}
I defined the as data and solved it temporarily.
Plotdata type ybins and PlotDatum type label etc There are a few missing attributes.
(Below is an image of a problem with the label attribute.)


コントリビューションガイド
このリポジトリのコントリビューションガイドは索引されていません
はじめの一歩
- issue を最後まで読み、次にプロジェクトのコントリビューションガイドを読みます。
- 着手することを issue にコメントします — 二人が同じ作業をするのを防げます。
- リポジトリをフォークし、ブランチを切って変更します。
- issue 番号を参照したプルリクエストを送ります。
調査の方向性
まず PlotData、PlotDatum、Data の TypeScript 宣言を見つけ、次に issue に示されている histogram のプロパティと label の使用方法を比較します。ybins、label、その他の報告された属性が正確に表現され、例がキャストなしで型チェックを通過すれば作業は完了です。issue ではテストファイルは指定されていません。
索引モデルが issue の本文から書いたものです。
評価
- 技術スタック
- javascript, react, typescript
- 領域
- data-visualization, frontend
- issue の種類
- バグ
- 難易度
- 3/5
- 見積もり時間
- 1〜2日
- 活発さ
- 停滞
- 明瞭さ
- おおむね明確
- 初心者へのやさしさ
- 35/100