plotly / plotly/react-plotly.js
There are no properties to use when using typeScript.
Nessuno ha ancora preso questa issue.
- Lingua principale
- JavaScript
- Stelle
- 1.1k
- Fork
- 138
- Merge medio
- 3g 2h
- PR unite (30g)
- 4
Descrizione
When using histogram charts, there are xbins properties but no ybins properties.
data={[
          {
            type: 'histogram',
            text: chartText,
            histfunc: 'sum',
            x,
            y,
            ybins: {
              start: y[y.length - 6],
              end: y[y.length - 1],
              size: 1
            }
          }
        ]}
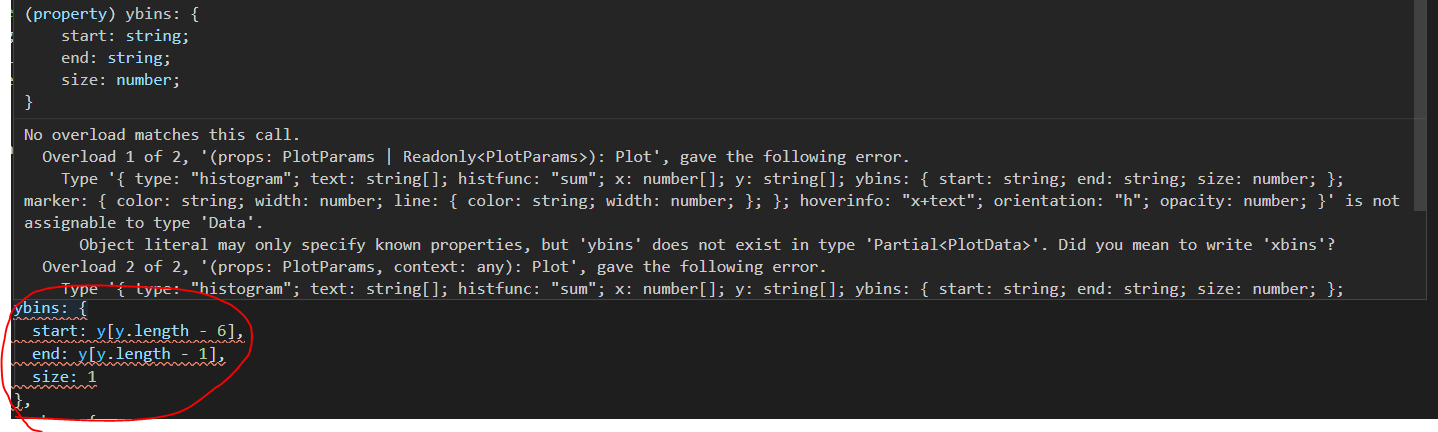
data={[
          {
            type: 'histogram',
            text: chartText,
            histfunc: 'sum',
            x,
            y,
            ybins: {
              start: y[y.length - 6],
              end: y[y.length - 1],
              size: 1
            }
          } as Data
        ]}
I defined the as data and solved it temporarily.
Plotdata type ybins and PlotDatum type label etc There are a few missing attributes.
(Below is an image of a problem with the label attribute.)


Guida per i contributori
Nessuna guida per i contributori indicizzata per questo repository
Come iniziare
- Leggi tutta la issue e poi la guida ai contributi del progetto.
- Commenta sulla issue per dire che te ne occupi tu — evita che due persone facciano lo stesso lavoro.
- Fai un fork del repository e lavora su un branch.
- Apri una pull request che faccia riferimento al numero della issue.
Direzione di ricerca
Inizia individuando le dichiarazioni TypeScript per PlotData, PlotDatum e Data, quindi confronta le proprietà dell'istogramma e l'uso di label mostrati nell'issue. Il lavoro è completato quando ybins, label e gli altri attributi segnalati sono rappresentati correttamente e gli esempi superano il type-check senza casts; nell'issue non viene indicato alcun file di test.
Scritto dal modello di indicizzazione a partire dal testo della issue.
Valutazione
- Stack tecnologico
- javascript, react, typescript
- Ambito
- data-visualization, frontend
- Tipo di issue
- Bug
- Difficoltà
- 3/5
- Tempo stimato
- 1-2 giorni
- Stato di attività
- Ferma
- Chiarezza
- Abbastanza chiara
- Idoneità per principianti
- 35/100