plotly / plotly/react-plotly.js
There are no properties to use when using typeScript.
未關閉
還沒有人認領這個 Issue。
- 主要語言
- JavaScript
- 星號
- 1.1k
- 分支
- 138
- 平均合併
- 3 天 2 小時
- 30 天內合併 PR
- 4
描述
When using histogram charts, there are xbins properties but no ybins properties.
data={[
          {
            type: 'histogram',
            text: chartText,
            histfunc: 'sum',
            x,
            y,
            ybins: {
              start: y[y.length - 6],
              end: y[y.length - 1],
              size: 1
            }
          }
        ]}
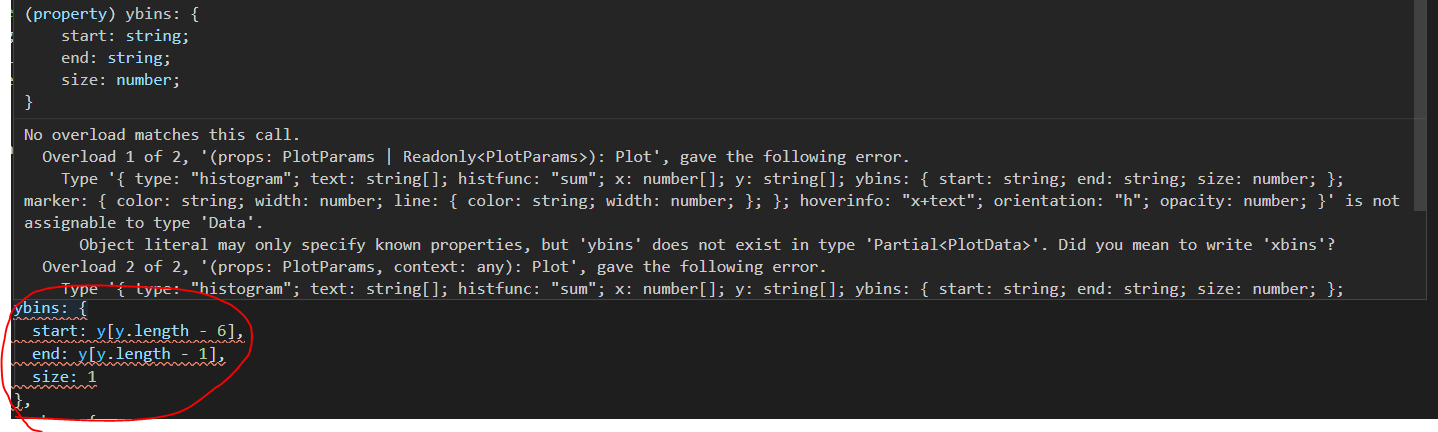
data={[
          {
            type: 'histogram',
            text: chartText,
            histfunc: 'sum',
            x,
            y,
            ybins: {
              start: y[y.length - 6],
              end: y[y.length - 1],
              size: 1
            }
          } as Data
        ]}
I defined the as data and solved it temporarily.
Plotdata type ybins and PlotDatum type label etc There are a few missing attributes.
(Below is an image of a problem with the label attribute.)


貢獻指南
這個儲存庫沒有索引到貢獻指南
從這裡開始
- 先讀完整個 Issue,再讀專案的貢獻指南。
- 在 Issue 下留言說明你要接手 —— 這能避免兩個人做同樣的事。
- Fork 儲存庫,在一個分支上完成修改。
- 送出 Pull Request,並在描述裡引用這個 Issue 編號。
研究方向
首先定位 PlotData、PlotDatum 和 Data 的 TypeScript 宣告,然後比較 issue 中展示的 histogram 屬性和 label 的使用方式。當 ybins、label 以及報告中的其他屬性都得到準確表示,且範例無需 casts 即可通過型別檢查時,工作就完成了;issue 中沒有指定測試檔案。
由索引模型根據 Issue 內容生成。
評估
- 技術堆疊
- javascript, react, typescript
- 領域
- data-visualization, frontend
- Issue 類型
- 缺陷
- 難度
- 3/5
- 預估耗時
- 1-2 天
- 活躍度
- 停滯
- 描述清晰度
- 基本清楚
- 新手友好度
- 35/100