plotly / plotly/react-plotly.js
Coordinates of a shape don't work
まだ誰も着手していません。
- 主要言語
- JavaScript
- スター
- 1.1k
- フォーク
- 138
- 平均マージ
- 3日 2時間
- マージ済み PR(30日)
- 4
説明
Probably it is something very stupid, but it is driving me crazy. I hope someone can help me.
I have been trying using shapes following the instructions... whichever X0, Y0, X1, Y1, I set, the shapes don't change position.
Here following I put a very simple component showing the problem. I would expect an horizontal line at Y = 14, but this is not the case. Whichever are the values in X0, Y0, X1, Y1 and the xref/yref settings the the output is always the same as shown in the attached image
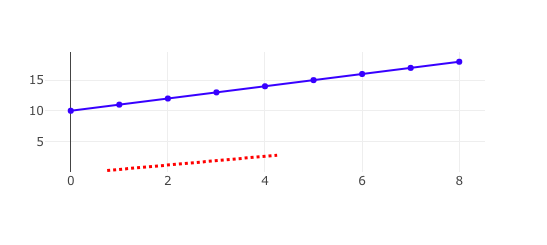
.
import React, { Component } from 'react';
import Plot from 'react-plotly.js';
class App extends Component {
render() {
const data = [{
x: [0,1,2,3,4,5,6,7,8],
y: [10,11,12,13,14,15,16,17,18],
type: 'scatter',
mode: 'lines+points',
marker: { color: 'blue'}
}];
  const layout = {
    width: 600,
    height: 300,
    showlegend: false,
    shapes: [
      {
        type: 'line',
        line: {
          color: 'red',
          width: 3,
          dash: 'dot',
        },
        X0: 0,
        Y0: 14,
        X1: 8,
        Y1: 14
      }
    ]
  };

  return (
    <Plot data={ data } layout={ layout}/>
  )
}
}
export default App;
コントリビューションガイド
このリポジトリのコントリビューションガイドは索引されていません
はじめの一歩
- issue を最後まで読み、次にプロジェクトのコントリビューションガイドを読みます。
- 着手することを issue にコメントします — 二人が同じ作業をするのを防げます。
- リポジトリをフォークし、ブランチを切って変更します。
- issue 番号を参照したプルリクエストを送ります。
調査の方向性
提供された App コンポーネントから始めて、layout.shapes 設定を調べます。特に、線に使用されている座標プロパティ名を確認してください。座標フィールドが認識された場合に、例が Y = 14 に水平な赤い線をレンダリングすることを確認してください。
索引モデルが issue の本文から書いたものです。
評価
- 技術スタック
- javascript, react
- 領域
- data-visualization, frontend
- issue の種類
- バグ
- 難易度
- 1/5
- 見積もり時間
- 1時間未満
- 活発さ
- 停滞
- 明瞭さ
- 明確に書かれている
- 初心者へのやさしさ
- 50/100