plotly / plotly/react-plotly.js
Coordinates of a shape don't work
还没有人认领这个 Issue。
- 主要语言
- JavaScript
- 星标
- 1.1k
- 派生
- 138
- 平均合并
- 3 天 2 小时
- 30 天内合并 PR
- 4
描述
Probably it is something very stupid, but it is driving me crazy. I hope someone can help me.
I have been trying using shapes following the instructions... whichever X0, Y0, X1, Y1, I set, the shapes don't change position.
Here following I put a very simple component showing the problem. I would expect an horizontal line at Y = 14, but this is not the case. Whichever are the values in X0, Y0, X1, Y1 and the xref/yref settings the the output is always the same as shown in the attached image
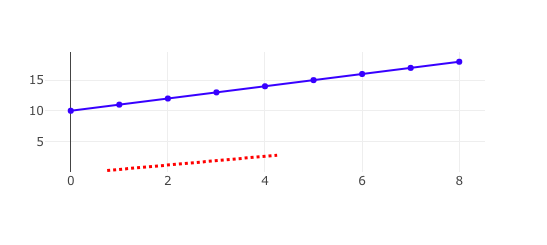
.
import React, { Component } from 'react';
import Plot from 'react-plotly.js';
class App extends Component {
render() {
const data = [{
x: [0,1,2,3,4,5,6,7,8],
y: [10,11,12,13,14,15,16,17,18],
type: 'scatter',
mode: 'lines+points',
marker: { color: 'blue'}
}];
  const layout = {
    width: 600,
    height: 300,
    showlegend: false,
    shapes: [
      {
        type: 'line',
        line: {
          color: 'red',
          width: 3,
          dash: 'dot',
        },
        X0: 0,
        Y0: 14,
        X1: 8,
        Y1: 14
      }
    ]
  };

  return (
    <Plot data={ data } layout={ layout}/>
  )
}
}
export default App;
贡献指南
这个仓库没有索引到贡献指南
从这里开始
- 先读完整个 Issue,再读项目的贡献指南。
- 在 Issue 下留言说明你要接手 —— 这能避免两个人做同样的事。
- Fork 仓库,在一个分支上完成修改。
- 提交 Pull Request,并在描述里引用这个 Issue 编号。
调研方向
从提供的 App 组件开始,检查 layout.shapes 配置,尤其是线条所使用的坐标属性名称。确认在坐标字段被识别时,该示例会在 Y = 14 处渲染一条水平红线。
由索引模型根据 Issue 内容生成。
评估
- 技术栈
- javascript, react
- 领域
- data-visualization, frontend
- Issue 类型
- 缺陷
- 难度
- 1/5
- 预计耗时
- 1 小时以内
- 活跃度
- 停滞
- 描述清晰度
- 描述清楚
- 新手友好度
- 50/100