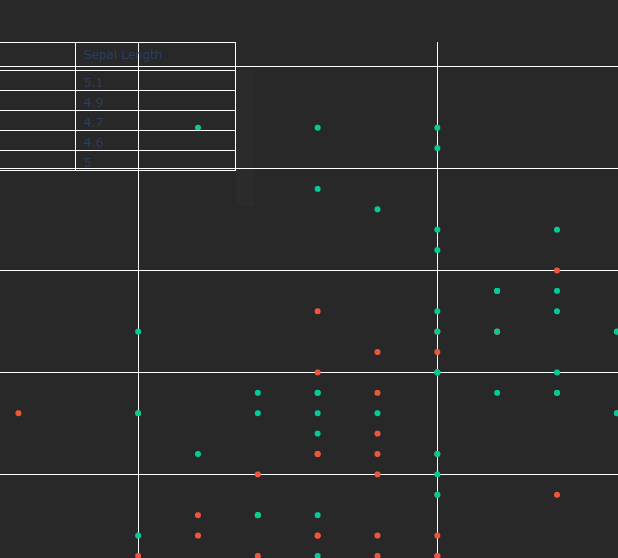
go.Table creates an unsightly and non-removable scroll bar when plotting on another figure.
Nobody has claimed this yet.
- Dominant language
- Python
- Stars
- 18.8k
- Forks
- 2.8k
- Avg merge
- 16h 26m
- Merged PRs (30d)
- 21
Description
When adding a small go.Table trace to a go.Figure object, the renderer creates a scrollbar which cannot be removed or hidden. This scrollbar is of low opacity, but is nonetheless noticable and ruins the professionalism of a graph upon which it is drawn. This is particularly apparent on dark backgrounds, and makes it impractical to place a go.Table in, for example, the upper left corner of a figure for displaying of additional information. Reproducible example and screenshot are provided.
import plotly.express as px
import plotly.graph_objects as go

# Load example dataset
df = px.data.iris()

# Create scatter plot
fig = px.scatter(df, x="sepal_width", y="sepal_length", color="species")

# Set plot background color
fig.update_layout(
    plot_bgcolor="rgb(40, 40, 40)",
    paper_bgcolor="rgb(40, 40, 40)",
)

# Create table trace
table_trace = go.Table(
    header=dict(
        values=["Species", "Sepal Width", "Sepal Length"],
        fill_color="rgba(0,0,0,0)",
        align="left",
    ),
    cells=dict(
        values=[
            df.species[:5],
            df.sepal_width[:5],
            df.sepal_length[:5],
        ],
        fill_color="rgba(0,0,0,0)",
        align="left",
    ),
)

# Add table trace to the top left third of the plot area
fig.add_trace(
    table_trace
)
fig.update_traces(
    selector=dict(type='table'),
    domain=dict(x=[0., 0.3], y=[0.8, 1])
)

# Show plot
fig.show()
Contributor guide
First steps
- Read the whole issue, then the project's contributing guide.
- Comment on the issue to say you are picking it up — it saves two people doing the same work.
- Fork the repository and make your change on a branch.
- Open a pull request that references the issue number.
Research direction
Start by running the provided Python reproduction in plotly.py and inspect how the renderer handles a go.Table trace positioned within another figure. Compare the result against the screenshot, then verify that the table can occupy the specified domain without displaying a visible, unwanted scrollbar.
Written by the indexing model from the issue text.
Assessment
- Tech stack
- python
- Domain
- data-visualization
- Issue type
- Bug
- Difficulty
- 4/5
- Estimated time
- 3-5 days
- Activity status
- Stale
- Clarity
- Mostly clear
- Newbie friendliness
- 35/100