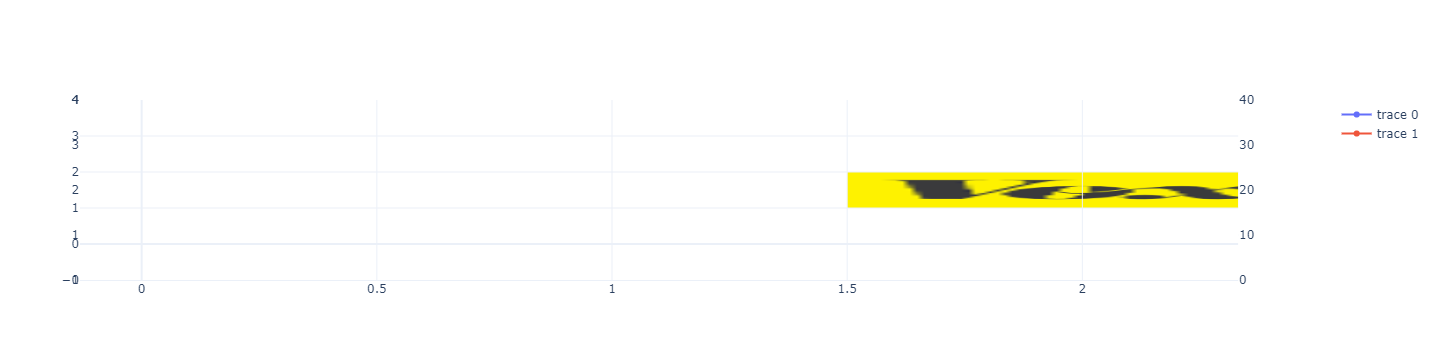
add_layout_image doesn't work with secondary_y
Open
Nobody has claimed this yet.
bug
P3
- Dominant language
- Python
- Stars
- 18.8k
- Forks
- 2.8k
- Avg merge
- 16h 26m
- Merged PRs (30d)
- 21
Description
Below is an example for which the second image is visible
fig = make_subplots(rows=1, cols=1, specs=[[{"secondary_y": True}]])

# Add trace
fig.add_trace(go.Scatter(x=[0, 0.5, 1, 2, 2.2], y=[1.23, 2.5, 0.42, 3, 1]))
fig.add_trace(go.Scatter(x=[0, 0.5, 1, 2, 2.2], y=[10.23, 20.5, 1.42, 30, 10]), secondary_y=True)
fig.update_yaxes(range=[0, 4], secondary_y=False)
fig.update_yaxes(range=[0, 40], secondary_y=True)

fig.add_layout_image(
    dict(
        source="https://images.plot.ly/language-icons/api-home/python-logo.png",
        xref="x",
        yref="y",
        x=0,
        y=1,
        sizex=1,
        sizey=1,
        sizing="stretch",
        opacity=1.0,
        layer="below",
    ),
    secondary_y=False,
)

fig.add_layout_image(
    dict(
        source="https://raw.githubusercontent.com/cldougl/plot_images/add_r_img/vox.png",
        xref="x",
        yref="y2",
        x=1.5,
        y=2,
        sizex=1,
        sizey=1,
        sizing="stretch",
        opacity=1.0,
        layer="below",
    ),
    secondary_y=True,
)

# Set templates
fig.update_layout(template="plotly_white")

fig.show()

replacing yref="y2", by yref="y", the image becomes visible but is anchored with the primary y axis (visible because of the sizey=1 and also when moving the axis range)

replacing yref="y2", by yref="y3", the image becomes visible but it is the only visible element
Contributor guide
First steps
- Read the whole issue, then the project's contributing guide.
- Comment on the issue to say you are picking it up — it saves two people doing the same work.
- Fork the repository and make your change on a branch.
- Open a pull request that references the issue number.
Research direction
Start with the supplied Python reproduction and trace the add_layout_image entry point, focusing on how secondary_y and yref="y2" are handled. The work is done when both layout images render at the correct primary and secondary y-axis positions while the plotted traces remain visible.
Written by the indexing model from the issue text.
Assessment
- Tech stack
- python
- Domain
- data-visualization
- Issue type
- Bug
- Difficulty
- 4/5
- Estimated time
- 3-5 days
- Activity status
- Stale
- Clarity
- Mostly clear
- Newbie friendliness
- 35/100