Surface Plot not potting values properly when there is only one piece of data in a row or column of the data
まだ誰も着手していません。
- 主要言語
- Python
- スター
- 18.8k
- フォーク
- 2.8k
- 平均マージ
- 16時間 26分
- マージ済み PR(30日)
- 21
説明
Here is the data I wanted to plot:
[[0.45 nan nan nan]
[0.25 0.4 nan nan]
[0.35 0.25 0.4 nan]
[0.4 0.25 0.5 0.25]]
in my code, this is stored in the variable 'result'
my code is the following:
`fig = go.Figure(data=[
go.Surface(z=result)
])
fig.update_layout(scene = dict(
xaxis_title='X axis',
yaxis_title='Y axis',
zaxis_title='Z axis'),
width=700,
margin=dict(r=20, b=10, l=10, t=10))
fig.show()`
the resulting graph is this:
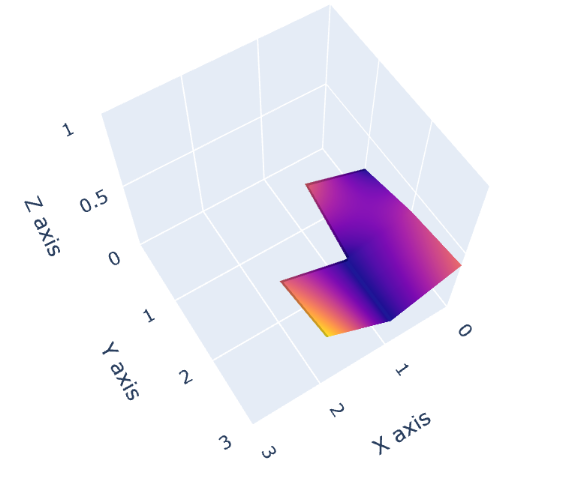
as you can see, 0.45 in the first row of the data is not plotted and 0.25 in the last column of the data is not plotted.
**note: I had to remove a bunch of code in my example for privacy purposes, but this still illustrates the bug.
コントリビューションガイド
はじめの一歩
- issue を最後まで読み、次にプロジェクトのコントリビューションガイドを読みます。
- 着手することを issue にコメントします — 二人が同じ作業をするのを防げます。
- リポジトリをフォークし、ブランチを切って変更します。
- issue 番号を参照したプルリクエストを送ります。
調査の方向性
まず、示された結果行列を使って提供された Python の例を実行し、fig.show() が使用する go.Surface のレンダリングパスを調べます。1 行目と最終列にある単一の非 NaN 値が省略されることを確認し、その後、両方の値がレンダリングされたサーフェスに表示されることを検証します。
索引モデルが issue の本文から書いたものです。
評価
- 技術スタック
- python
- 領域
- data-visualization
- issue の種類
- バグ
- 難易度
- 3/5
- 見積もり時間
- 1〜2日
- 活発さ
- 停滞
- 明瞭さ
- 明確に書かれている
- 初心者へのやさしさ
- 48/100