Surface Plot not potting values properly when there is only one piece of data in a row or column of the data
还没有人认领这个 Issue。
- 主要语言
- Python
- 星标
- 18.8k
- 派生
- 2.8k
- 平均合并
- 16 小时 26 分钟
- 30 天内合并 PR
- 21
描述
Here is the data I wanted to plot:
[[0.45 nan nan nan]
[0.25 0.4 nan nan]
[0.35 0.25 0.4 nan]
[0.4 0.25 0.5 0.25]]
in my code, this is stored in the variable 'result'
my code is the following:
`fig = go.Figure(data=[
go.Surface(z=result)
])
fig.update_layout(scene = dict(
xaxis_title='X axis',
yaxis_title='Y axis',
zaxis_title='Z axis'),
width=700,
margin=dict(r=20, b=10, l=10, t=10))
fig.show()`
the resulting graph is this:
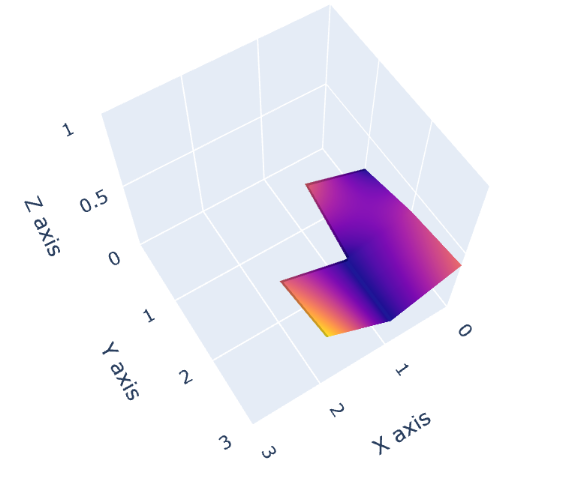
as you can see, 0.45 in the first row of the data is not plotted and 0.25 in the last column of the data is not plotted.
**note: I had to remove a bunch of code in my example for privacy purposes, but this still illustrates the bug.
贡献指南
从这里开始
- 先读完整个 Issue,再读项目的贡献指南。
- 在 Issue 下留言说明你要接手 —— 这能避免两个人做同样的事。
- Fork 仓库,在一个分支上完成修改。
- 提交 Pull Request,并在描述里引用这个 Issue 编号。
调研方向
首先,使用所示的结果矩阵运行提供的 Python 示例,并检查 fig.show() 使用的 go.Surface 渲染路径。确认第一行和最后一列中唯一的非 NaN 值被省略,然后验证这两个值都出现在渲染后的曲面中。
由索引模型根据 Issue 内容生成。
评估
- 技术栈
- python
- 领域
- data-visualization
- Issue 类型
- 缺陷
- 难度
- 3/5
- 预计耗时
- 1-2 天
- 活跃度
- 停滞
- 描述清晰度
- 描述清楚
- 新手友好度
- 48/100