Surface Plot not potting values properly when there is only one piece of data in a row or column of the data
Dieses Issue hat noch niemand übernommen.
- Vorherrschende Sprache
- Python
- Sterne
- 18.8k
- Forks
- 2.8k
- Ø Merge
- 16 Std. 26 Min.
- Gemergte PRs (30 T.)
- 21
Beschreibung
Here is the data I wanted to plot:
[[0.45 nan nan nan]
[0.25 0.4 nan nan]
[0.35 0.25 0.4 nan]
[0.4 0.25 0.5 0.25]]
in my code, this is stored in the variable 'result'
my code is the following:
`fig = go.Figure(data=[
go.Surface(z=result)
])
fig.update_layout(scene = dict(
xaxis_title='X axis',
yaxis_title='Y axis',
zaxis_title='Z axis'),
width=700,
margin=dict(r=20, b=10, l=10, t=10))
fig.show()`
the resulting graph is this:
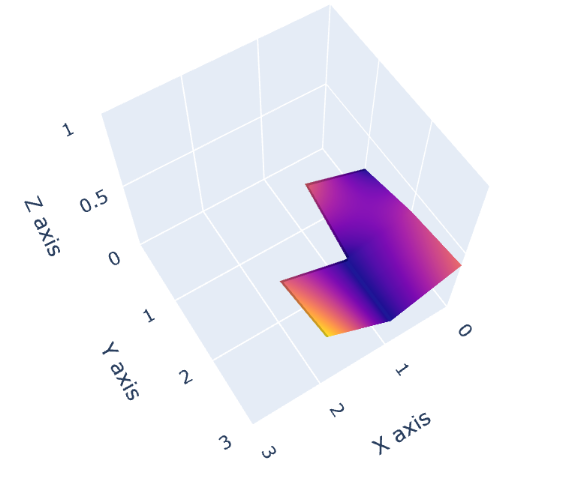
as you can see, 0.45 in the first row of the data is not plotted and 0.25 in the last column of the data is not plotted.
**note: I had to remove a bunch of code in my example for privacy purposes, but this still illustrates the bug.
Beitragsleitfaden
Erste Schritte
- Lies das ganze Issue und danach den Beitragsleitfaden des Projekts.
- Schreib ins Issue, dass du es übernimmst — das erspart doppelte Arbeit.
- Forke das Repository und arbeite in einem Branch.
- Öffne einen Pull Request, der die Issue-Nummer nennt.
Rechercherichtung
Beginne damit, das bereitgestellte Python-Beispiel mit der gezeigten Ergebnismatrix auszuführen, und untersuche den von fig.show() verwendeten go.Surface-Renderingpfad. Bestätige, dass die einzelnen Nicht-NaN-Werte in der ersten Zeile und der letzten Spalte ausgelassen werden, und überprüfe anschließend, dass beide Werte in der gerenderten Oberfläche erscheinen.
Vom Indexierungsmodell aus dem Issue-Text verfasst.
Bewertung
- Tech-Stack
- python
- Bereich
- data-visualization
- Issue-Typ
- Bug
- Schwierigkeit
- 3/5
- Geschätzter Aufwand
- 1-2 Tage
- Aktivitätsstatus
- Veraltet
- Klarheit
- Klar beschrieben
- Anfängerfreundlichkeit
- 48/100