Scattergl (WebGL) lines are not well behaved when zoomed very close
Chưa có ai nhận issue này.
- Ngôn ngữ chính
- Python
- Star
- 18.8k
- Fork
- 2.8k
- Merge trung bình
- 16 giờ 26 phút
- Pull request đã merge (30 ngày)
- 21
Mô tả
Plotly version 4.11.0
Plotting offline
This was discovered while working on time-series data that covers a large time span (months) but has interesting features at a very low time span (seconds). The original data was defined using pandas dataframes and timestamps but I have removed those references from my example in favor of the python built-in datetime type, though they appear to behave the same.
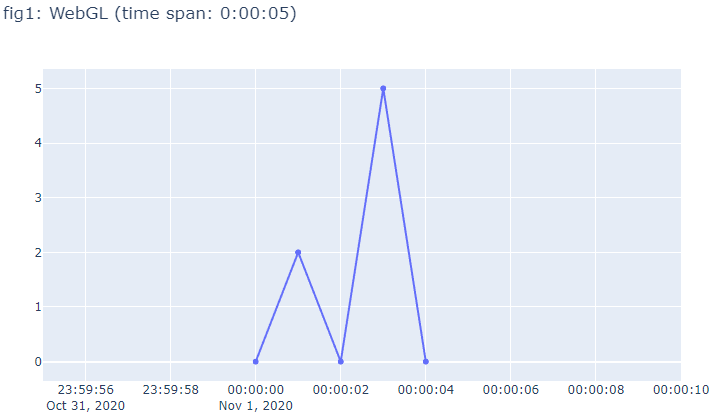
In the example below, fig1 and fig3 look fine, but the lines and dots in fig2 are not aligned like they should be. The issue is exaggerated with even larger time spans. Although using Scatter() in place of Scattergl() is a workaround for this issue, I would prefer to continue using Scattergl() to take advantage of the increased performance.
Other things I have noticed while investigating:
- The misalignment is only in the horizontal direction.
- The lines appear to "jitter" as the figure is scaled on the x-axis (for example, grabbing the right corner of the xaxis using the mouse and dragging it right or left).
- The issue may be hardware specific. I could not reproduce the issue on my laptop which has an intel CPU with integrated graphics. The issue was discovered on an intel CPU in a desktop using a discrete Radeon GPU.
import datetime
import plotly.graph_objects as go

# Define data:
date_format = '%Y-%m-%d %H:%M:%S'
dates = ['2020-11-01 0:0:0', '2020-11-01 0:0:1', '2020-11-01 0:0:2', '2020-11-01 0:0:3', '2020-11-01 0:0:4', '2020-11-01 0:0:5']
xvals = [datetime.datetime.strptime(this_date, date_format) for this_date in dates]
yvals = [0, 2, 0, 5, 0]

# Add one value on to the start of the data that is far away from the rest of the data
xvals_stretched = [datetime.datetime.strptime('2020-06-01 0:0:0', date_format)] + xvals
yvals_stretched = [0] + yvals

# Set the initial zoom to show the interesting part of the data
x_window_left = datetime.datetime(2020, 10, 31, 23, 59, 55)
x_window_right = datetime.datetime(2020, 11, 1, 0, 0, 10)

# %% A simple plot that works fine with Scattergl
fig1 = go.Figure()
trace = go.Scattergl(x=xvals, y=yvals)
fig1.add_trace(trace)
fig1.update_layout(title=f'fig1: WebGL (time span: {xvals[-1] - xvals[0]})')
fig1.update_xaxes(range=[x_window_left, x_window_right])
fig1.show(renderer='browser')

# %% The same simple plot with one extra datapoint that is far away on the x-axis
fig2 = go.Figure()
trace = go.Scattergl(x=xvals_stretched, y=yvals_stretched)
fig2.add_trace(trace)
fig2.update_layout(title=f'fig2: WebGL (time span: {xvals_stretched[-1] - xvals_stretched[0]})')
fig2.update_xaxes(range=[x_window_left, x_window_right])
fig2.show(renderer='browser')

# %% The stretched plot but without using Scattergl
fig3 = go.Figure()
trace = go.Scatter(x=xvals_stretched, y=yvals_stretched)
fig3.add_trace(trace)
fig3.update_layout(title=f'fig3: SVG (time span: {xvals_stretched[-1] - xvals_stretched[0]})')
fig3.update_xaxes(range=[x_window_left, x_window_right])
fig3.show(renderer='browser')
Running this code should produce three figures illustrating the issue:


Hướng dẫn đóng góp
Bắt đầu từ đâu
- Đọc hết issue, rồi đọc hướng dẫn đóng góp của dự án.
- Bình luận trên issue rằng bạn sẽ nhận — tránh hai người làm cùng một việc.
- Fork repository và làm thay đổi trên một nhánh.
- Mở pull request có tham chiếu số hiệu của issue.
Hướng nghiên cứu
Chạy trình tái hiện Python được cung cấp với ba hình và so sánh kết quả của Scattergl và Scatter khi phóng to trục x. Theo dõi đường dẫn kết xuất của Scattergl đối với dữ liệu datetime có giá trị x ở xa; được xem là hoàn tất khi các đường và marker vẫn căn chỉnh theo chiều ngang và ổn định trong khi phóng to và thay đổi tỷ lệ, mà không làm mất các lợi ích về hiệu năng của Scattergl.
Do mô hình lập chỉ mục viết ra từ nội dung của issue.
Đánh giá
- Công nghệ
- python
- Lĩnh vực
- data-visualization
- Loại issue
- Lỗi
- Độ khó
- 4/5
- Thời gian dự kiến
- 3-5 ngày
- Mức độ hoạt động
- Sôi nổi
- Độ rõ ràng
- Khá rõ ràng
- Mức phù hợp với người mới
- 55/100