Scattergl (WebGL) lines are not well behaved when zoomed very close
还没有人认领这个 Issue。
- 主要语言
- Python
- 星标
- 18.8k
- 派生
- 2.8k
- 平均合并
- 16 小时 26 分钟
- 30 天内合并 PR
- 21
描述
Plotly version 4.11.0
Plotting offline
This was discovered while working on time-series data that covers a large time span (months) but has interesting features at a very low time span (seconds). The original data was defined using pandas dataframes and timestamps but I have removed those references from my example in favor of the python built-in datetime type, though they appear to behave the same.
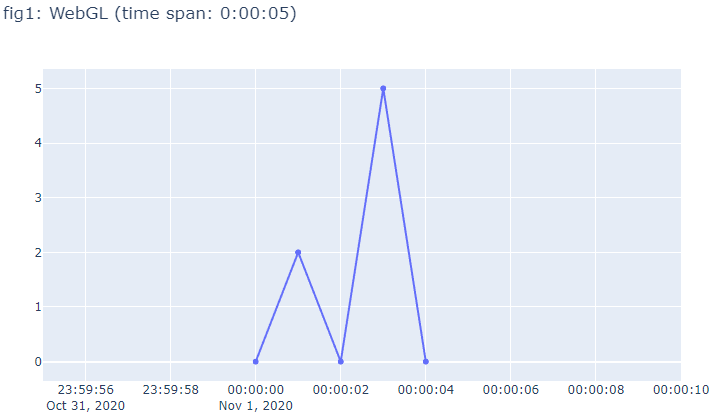
In the example below, fig1 and fig3 look fine, but the lines and dots in fig2 are not aligned like they should be. The issue is exaggerated with even larger time spans. Although using Scatter() in place of Scattergl() is a workaround for this issue, I would prefer to continue using Scattergl() to take advantage of the increased performance.
Other things I have noticed while investigating:
- The misalignment is only in the horizontal direction.
- The lines appear to "jitter" as the figure is scaled on the x-axis (for example, grabbing the right corner of the xaxis using the mouse and dragging it right or left).
- The issue may be hardware specific. I could not reproduce the issue on my laptop which has an intel CPU with integrated graphics. The issue was discovered on an intel CPU in a desktop using a discrete Radeon GPU.
import datetime
import plotly.graph_objects as go

# Define data:
date_format = '%Y-%m-%d %H:%M:%S'
dates = ['2020-11-01 0:0:0', '2020-11-01 0:0:1', '2020-11-01 0:0:2', '2020-11-01 0:0:3', '2020-11-01 0:0:4', '2020-11-01 0:0:5']
xvals = [datetime.datetime.strptime(this_date, date_format) for this_date in dates]
yvals = [0, 2, 0, 5, 0]

# Add one value on to the start of the data that is far away from the rest of the data
xvals_stretched = [datetime.datetime.strptime('2020-06-01 0:0:0', date_format)] + xvals
yvals_stretched = [0] + yvals

# Set the initial zoom to show the interesting part of the data
x_window_left = datetime.datetime(2020, 10, 31, 23, 59, 55)
x_window_right = datetime.datetime(2020, 11, 1, 0, 0, 10)

# %% A simple plot that works fine with Scattergl
fig1 = go.Figure()
trace = go.Scattergl(x=xvals, y=yvals)
fig1.add_trace(trace)
fig1.update_layout(title=f'fig1: WebGL (time span: {xvals[-1] - xvals[0]})')
fig1.update_xaxes(range=[x_window_left, x_window_right])
fig1.show(renderer='browser')

# %% The same simple plot with one extra datapoint that is far away on the x-axis
fig2 = go.Figure()
trace = go.Scattergl(x=xvals_stretched, y=yvals_stretched)
fig2.add_trace(trace)
fig2.update_layout(title=f'fig2: WebGL (time span: {xvals_stretched[-1] - xvals_stretched[0]})')
fig2.update_xaxes(range=[x_window_left, x_window_right])
fig2.show(renderer='browser')

# %% The stretched plot but without using Scattergl
fig3 = go.Figure()
trace = go.Scatter(x=xvals_stretched, y=yvals_stretched)
fig3.add_trace(trace)
fig3.update_layout(title=f'fig3: SVG (time span: {xvals_stretched[-1] - xvals_stretched[0]})')
fig3.update_xaxes(range=[x_window_left, x_window_right])
fig3.show(renderer='browser')
Running this code should produce three figures illustrating the issue:


贡献指南
从这里开始
- 先读完整个 Issue,再读项目的贡献指南。
- 在 Issue 下留言说明你要接手 —— 这能避免两个人做同样的事。
- Fork 仓库,在一个分支上完成修改。
- 提交 Pull Request,并在描述里引用这个 Issue 编号。
调研方向
使用提供的 Python 复现程序和三个图进行运行,并在缩放 x 轴时比较 Scattergl 和 Scatter 的结果。跟踪 Scattergl 对带有远距离 x 值的 datetime 数据的渲染路径;当线和标记在缩放及重新调整比例时仍保持水平对齐和稳定,且不损失 Scattergl 的性能优势时,即视为完成。
由索引模型根据 Issue 内容生成。
评估
- 技术栈
- python
- 领域
- data-visualization
- Issue 类型
- 缺陷
- 难度
- 4/5
- 预计耗时
- 3-5 天
- 活跃度
- 活跃
- 描述清晰度
- 基本清楚
- 新手友好度
- 55/100