Scattergl (WebGL) lines are not well behaved when zoomed very close
Personne n'a encore pris cette issue.
- Langage dominant
- Python
- Étoiles
- 18.8k
- Forks
- 2.8k
- Merge moyen
- 16 h 26 min
- PR mergées (30 j)
- 21
Description
Plotly version 4.11.0
Plotting offline
This was discovered while working on time-series data that covers a large time span (months) but has interesting features at a very low time span (seconds). The original data was defined using pandas dataframes and timestamps but I have removed those references from my example in favor of the python built-in datetime type, though they appear to behave the same.
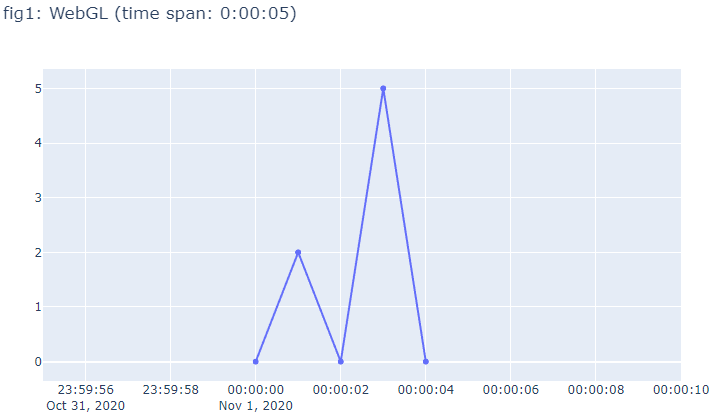
In the example below, fig1 and fig3 look fine, but the lines and dots in fig2 are not aligned like they should be. The issue is exaggerated with even larger time spans. Although using Scatter() in place of Scattergl() is a workaround for this issue, I would prefer to continue using Scattergl() to take advantage of the increased performance.
Other things I have noticed while investigating:
- The misalignment is only in the horizontal direction.
- The lines appear to "jitter" as the figure is scaled on the x-axis (for example, grabbing the right corner of the xaxis using the mouse and dragging it right or left).
- The issue may be hardware specific. I could not reproduce the issue on my laptop which has an intel CPU with integrated graphics. The issue was discovered on an intel CPU in a desktop using a discrete Radeon GPU.
import datetime
import plotly.graph_objects as go

# Define data:
date_format = '%Y-%m-%d %H:%M:%S'
dates = ['2020-11-01 0:0:0', '2020-11-01 0:0:1', '2020-11-01 0:0:2', '2020-11-01 0:0:3', '2020-11-01 0:0:4', '2020-11-01 0:0:5']
xvals = [datetime.datetime.strptime(this_date, date_format) for this_date in dates]
yvals = [0, 2, 0, 5, 0]

# Add one value on to the start of the data that is far away from the rest of the data
xvals_stretched = [datetime.datetime.strptime('2020-06-01 0:0:0', date_format)] + xvals
yvals_stretched = [0] + yvals

# Set the initial zoom to show the interesting part of the data
x_window_left = datetime.datetime(2020, 10, 31, 23, 59, 55)
x_window_right = datetime.datetime(2020, 11, 1, 0, 0, 10)

# %% A simple plot that works fine with Scattergl
fig1 = go.Figure()
trace = go.Scattergl(x=xvals, y=yvals)
fig1.add_trace(trace)
fig1.update_layout(title=f'fig1: WebGL (time span: {xvals[-1] - xvals[0]})')
fig1.update_xaxes(range=[x_window_left, x_window_right])
fig1.show(renderer='browser')

# %% The same simple plot with one extra datapoint that is far away on the x-axis
fig2 = go.Figure()
trace = go.Scattergl(x=xvals_stretched, y=yvals_stretched)
fig2.add_trace(trace)
fig2.update_layout(title=f'fig2: WebGL (time span: {xvals_stretched[-1] - xvals_stretched[0]})')
fig2.update_xaxes(range=[x_window_left, x_window_right])
fig2.show(renderer='browser')

# %% The stretched plot but without using Scattergl
fig3 = go.Figure()
trace = go.Scatter(x=xvals_stretched, y=yvals_stretched)
fig3.add_trace(trace)
fig3.update_layout(title=f'fig3: SVG (time span: {xvals_stretched[-1] - xvals_stretched[0]})')
fig3.update_xaxes(range=[x_window_left, x_window_right])
fig3.show(renderer='browser')
Running this code should produce three figures illustrating the issue:


Guide de contribution
Ouvrir le guide de contribution
Par où commencer
- Lisez l'issue en entier, puis le guide de contribution du projet.
- Signalez en commentaire que vous la prenez — cela évite que deux personnes fassent le même travail.
- Forkez le dépôt et travaillez sur une branche.
- Ouvrez une pull request qui référence le numéro de l'issue.
Piste de recherche
Exécutez le reproducteur Python fourni avec les trois figures et comparez les résultats de Scattergl et Scatter lors d'un zoom sur l'axe x. Suivez le chemin de rendu de Scattergl pour des données datetime avec une valeur x éloignée ; le travail est considéré comme terminé lorsque les lignes et les marqueurs restent alignés horizontalement et stables lors du zoom et du changement d'échelle, sans perdre les avantages de performance de Scattergl.
Rédigé par le modèle d'indexation à partir du texte de l'issue.
Évaluation
- Stack technique
- python
- Domaine
- data-visualization
- Type d'issue
- Bug
- Difficulté
- 4/5
- Temps estimé
- 3-5 jours
- Activité
- Active
- Clarté
- Plutôt claire
- Accessibilité débutants
- 55/100