Layer disappears if zoomed out. Reappears when zooming.
Chưa có ai nhận issue này.
- Ngôn ngữ chính
- Python
- Star
- 18.8k
- Fork
- 2.8k
- Merge trung bình
- 16 giờ 26 phút
- Pull request đã merge (30 ngày)
- 21
Mô tả
Issue:
Objects will disappear if the zoom level of the graph is increased to a certain amount.
Demo:
-
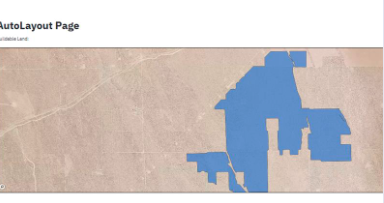
-
Image 1: Zoomed out version of a graph
-
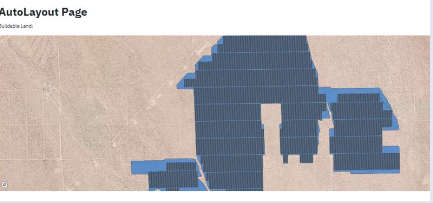
-
Image 2: Zoomed in version of the same graph
Specifications:
Plotly Version: 4.10.0
Code:
I included pickled versions of the buildable land / trackers objects here. They are geodataframes.
    # --- Set up base map ---
    fig = go.Figure(go.Scattermapbox())
    fig.update_layout(
        mapbox_accesstoken = token,
        mapbox_style = "mapbox://styles/skrhee/ckbtiaefh0wrr1hp7h4ya3zy4",
        mapbox_zoom = 13,
        mapbox_center = {'lon': centroid_lon, 'lat': centroid_lat},
        margin = {'l':0, 'r':0, 'b':0, 't':0},
        height = 500
        )

    layers = []
    # --- Add buildable polygons ---
    full_buildable = MultiPolygon(list(buildable_land['geometry']))
    obj = gd.GeoSeries(full_buildable).to_json()
    poly_json = json.loads(obj)

    layer = {
        'source': poly_json,
        'type': "fill",
        'below': "traces",
        'color': "royalblue",
        'opacity': 0.65
        }
    layers.append(layer)

    # --- Add tracker polygons ---
    trackers = gd.read_file(df['AL_0.0'][0])
    full_trackers = MultiPolygon(list(trackers['geometry']))
    obj = gd.GeoSeries(full_trackers).to_json()
    poly_json = json.loads(obj)

    layer = {
        'source': poly_json,
        'type': "fill",
        'below': "traces",
        'color': "royalblue",
        'opacity': 0.65
        }
    layers.append(layer)


    # --- Update Figure ---
    fig.update_layout(
        mapbox = {
            'layers': layers
            }
        )

    st.plotly_chart(fig, use_container_width=True)


[pickles.zip](https://github.com/plotly/plotly.py/files/5343508/pickles.zip)
Hướng dẫn đóng góp
Bắt đầu từ đâu
- Đọc hết issue, rồi đọc hướng dẫn đóng góp của dự án.
- Bình luận trên issue rằng bạn sẽ nhận — tránh hai người làm cùng một việc.
- Fork repository và làm thay đổi trên một nhánh.
- Mở pull request có tham chiếu số hiệu của issue.
Hướng nghiên cứu
Bắt đầu bằng cách tái hiện hành vi với các mapbox layers được cấu hình trong fig.update_layout và được render thông qua st.plotly_chart. Xác minh xem các lớp polygon có vẫn hiển thị ở các mức thu phóng khác nhau hay không, sử dụng code và pickles được cung cấp nếu có thể tải chúng; được xem là hoàn tất khi các lớp không còn biến mất lúc thu nhỏ.
Do mô hình lập chỉ mục viết ra từ nội dung của issue.
Đánh giá
- Công nghệ
- plotly, python
- Lĩnh vực
- data-visualization
- Loại issue
- Lỗi
- Độ khó
- 4/5
- Thời gian dự kiến
- 3-5 ngày
- Mức độ hoạt động
- Đình trệ
- Độ rõ ràng
- Cần làm rõ
- Mức phù hợp với người mới
- 35/100