Layer disappears if zoomed out. Reappears when zooming.
未關閉
還沒有人認領這個 Issue。
bug
P3
- 主要語言
- Python
- 星號
- 18.8k
- 分支
- 2.8k
- 平均合併
- 16 小時 26 分鐘
- 30 天內合併 PR
- 21
描述
Issue:
Objects will disappear if the zoom level of the graph is increased to a certain amount.
Demo:
-
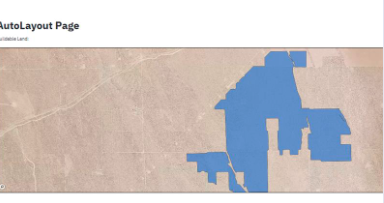
-
Image 1: Zoomed out version of a graph
-
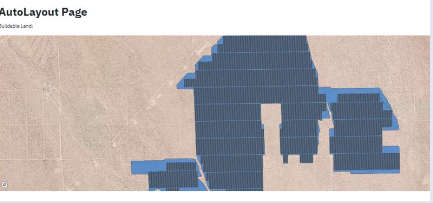
-
Image 2: Zoomed in version of the same graph
Specifications:
Plotly Version: 4.10.0
Code:
I included pickled versions of the buildable land / trackers objects here. They are geodataframes.
    # --- Set up base map ---
    fig = go.Figure(go.Scattermapbox())
    fig.update_layout(
        mapbox_accesstoken = token,
        mapbox_style = "mapbox://styles/skrhee/ckbtiaefh0wrr1hp7h4ya3zy4",
        mapbox_zoom = 13,
        mapbox_center = {'lon': centroid_lon, 'lat': centroid_lat},
        margin = {'l':0, 'r':0, 'b':0, 't':0},
        height = 500
        )

    layers = []
    # --- Add buildable polygons ---
    full_buildable = MultiPolygon(list(buildable_land['geometry']))
    obj = gd.GeoSeries(full_buildable).to_json()
    poly_json = json.loads(obj)

    layer = {
        'source': poly_json,
        'type': "fill",
        'below': "traces",
        'color': "royalblue",
        'opacity': 0.65
        }
    layers.append(layer)

    # --- Add tracker polygons ---
    trackers = gd.read_file(df['AL_0.0'][0])
    full_trackers = MultiPolygon(list(trackers['geometry']))
    obj = gd.GeoSeries(full_trackers).to_json()
    poly_json = json.loads(obj)

    layer = {
        'source': poly_json,
        'type': "fill",
        'below': "traces",
        'color': "royalblue",
        'opacity': 0.65
        }
    layers.append(layer)


    # --- Update Figure ---
    fig.update_layout(
        mapbox = {
            'layers': layers
            }
        )

    st.plotly_chart(fig, use_container_width=True)


[pickles.zip](https://github.com/plotly/plotly.py/files/5343508/pickles.zip)
貢獻指南
從這裡開始
- 先讀完整個 Issue,再讀專案的貢獻指南。
- 在 Issue 下留言說明你要接手 —— 這能避免兩個人做同樣的事。
- Fork 儲存庫,在一個分支上完成修改。
- 送出 Pull Request,並在描述裡引用這個 Issue 編號。
研究方向
首先,使用在 fig.update_layout 中設定並透過 st.plotly_chart 繪製的 mapbox layers 重現此行為。使用提供的程式碼和 pickles(如果可以載入)確認多邊形圖層在不同縮放層級下是否仍保持可見;縮小地圖時圖層不再消失即表示完成。
由索引模型根據 Issue 內容生成。
評估
- 技術堆疊
- plotly, python
- 領域
- data-visualization
- Issue 類型
- 缺陷
- 難度
- 4/5
- 預估耗時
- 3-5 天
- 活躍度
- 停滯
- 描述清晰度
- 需要釐清
- 新手友好度
- 35/100