Layer disappears if zoomed out. Reappears when zooming.
Ninguém assumiu esta issue ainda.
- Linguagem predominante
- Python
- Estrelas
- 18.8k
- Forks
- 2.8k
- Merge médio
- 16h 26min
- PRs com merge (30d)
- 21
Descrição
Issue:
Objects will disappear if the zoom level of the graph is increased to a certain amount.
Demo:
-
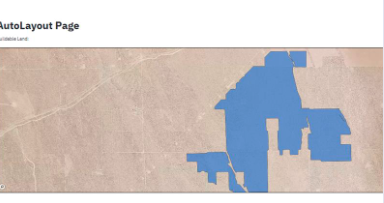
-
Image 1: Zoomed out version of a graph
-
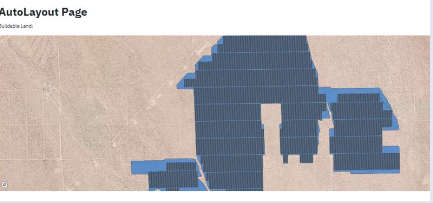
-
Image 2: Zoomed in version of the same graph
Specifications:
Plotly Version: 4.10.0
Code:
I included pickled versions of the buildable land / trackers objects here. They are geodataframes.
    # --- Set up base map ---
    fig = go.Figure(go.Scattermapbox())
    fig.update_layout(
        mapbox_accesstoken = token,
        mapbox_style = "mapbox://styles/skrhee/ckbtiaefh0wrr1hp7h4ya3zy4",
        mapbox_zoom = 13,
        mapbox_center = {'lon': centroid_lon, 'lat': centroid_lat},
        margin = {'l':0, 'r':0, 'b':0, 't':0},
        height = 500
        )

    layers = []
    # --- Add buildable polygons ---
    full_buildable = MultiPolygon(list(buildable_land['geometry']))
    obj = gd.GeoSeries(full_buildable).to_json()
    poly_json = json.loads(obj)

    layer = {
        'source': poly_json,
        'type': "fill",
        'below': "traces",
        'color': "royalblue",
        'opacity': 0.65
        }
    layers.append(layer)

    # --- Add tracker polygons ---
    trackers = gd.read_file(df['AL_0.0'][0])
    full_trackers = MultiPolygon(list(trackers['geometry']))
    obj = gd.GeoSeries(full_trackers).to_json()
    poly_json = json.loads(obj)

    layer = {
        'source': poly_json,
        'type': "fill",
        'below': "traces",
        'color': "royalblue",
        'opacity': 0.65
        }
    layers.append(layer)


    # --- Update Figure ---
    fig.update_layout(
        mapbox = {
            'layers': layers
            }
        )

    st.plotly_chart(fig, use_container_width=True)


[pickles.zip](https://github.com/plotly/plotly.py/files/5343508/pickles.zip)
Guia de contribuição
Primeiros passos
- Leia a issue inteira e depois o guia de contribuição do projeto.
- Comente na issue dizendo que vai assumir — evita que duas pessoas façam o mesmo trabalho.
- Faça um fork do repositório e trabalhe em uma branch.
- Abra um pull request que referencie o número da issue.
Direção de pesquisa
Comece reproduzindo o comportamento com as mapbox layers configuradas em fig.update_layout e renderizadas por meio de st.plotly_chart. Verifique se as camadas de polígonos permanecem visíveis em diferentes níveis de zoom, usando o código e os pickles fornecidos se eles puderem ser carregados; considera-se concluído quando as camadas não desaparecem mais ao diminuir o zoom.
Escrita pelo modelo de indexação a partir do texto da issue.
Avaliação
- Stack de tecnologia
- plotly, python
- Domínio
- data-visualization
- Tipo de issue
- Bug
- Dificuldade
- 4/5
- Tempo estimado
- 3-5 dias
- Status de atividade
- Estagnada
- Clareza
- Precisa de esclarecimento
- Facilidade para iniciantes
- 35/100