unexpected histogram bin size behavior
オープン
まだ誰も着手していません。
bug
P3
- 主要言語
- JavaScript
- スター
- 18.3k
- フォーク
- 2k
- 平均マージ
- 2日 12時間
- マージ済み PR(30日)
- 28
説明
If the maximum number in the interval is a multiple of the bin size, then this number is lost.
Here is a code example:
var x = [1.0, 9.1, 10.0, 17.8, 18.5, 20.0];

var trace = {
    x: x,
    type: 'histogram',
    autobinx: false,
    xbins: {
      end: 20.0,
      size: 10.0,
      start: 0
    }
};
var data = [trace];
Plotly.newPlot('myDiv', data);
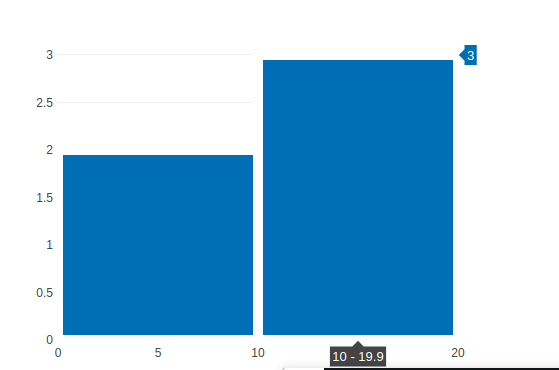
This is the result of using the notation [a; b) when creating groups. This behavior creates a problem, for example, when you want to dynamically adjust the bin size depending on the step. Here is an example:
var data = [1.0, 9.1, 10.0, 17.8, 18.5, 20.0];

step = 1.0; // any value from the interval: [0; 1]

xbins_start = data.reduce((x, y) => Math.min(x, y), 0.0);
xbins_end   = data.reduce((x, y) => Math.max(x, y), 0.0);
xbins_size  = (step * (xbins_end - xbins_start));

var trace = {
    x: data,
    type: 'histogram',
    autobinx: false,
    xbins: {
      start: xbins_start,
      end: xbins_end,
      size: xbins_size
    }
};

Plotly.newPlot('myDiv', [trace]);
By setting the step size to 1, I hope to get the only one group containing all the data values (the height of the bin should be 6), instead I get a height of 5 with the loss of the maximum value.

コントリビューションガイド
はじめの一歩
- issue を最後まで読み、次にプロジェクトのコントリビューションガイドを読みます。
- 着手することを issue にコメントします — 二人が同じ作業をするのを防げます。
- リポジトリをフォークし、ブランチを切って変更します。
- issue 番号を参照したプルリクエストを送ります。
調査の方向性
issue の JavaScript reproduction から始め、明示的な xbins の start、end、size 値に対するヒストグラムのビニング経路を追跡してください。提供されたデータで境界の挙動を検証し、end と等しい値が結果の bin にカウントされることを確認してください。
索引モデルが issue の本文から書いたものです。
評価
- 技術スタック
- javascript
- 領域
- data-visualization
- issue の種類
- バグ
- 難易度
- 3/5
- 見積もり時間
- 1〜2日
- 活発さ
- 停滞
- 明瞭さ
- おおむね明確
- 初心者へのやさしさ
- 35/100