unexpected histogram bin size behavior
Dieses Issue hat noch niemand übernommen.
- Vorherrschende Sprache
- JavaScript
- Sterne
- 18.3k
- Forks
- 2k
- Ø Merge
- 2 T. 12 Std.
- Gemergte PRs (30 T.)
- 28
Beschreibung
If the maximum number in the interval is a multiple of the bin size, then this number is lost.
Here is a code example:
var x = [1.0, 9.1, 10.0, 17.8, 18.5, 20.0];

var trace = {
    x: x,
    type: 'histogram',
    autobinx: false,
    xbins: {
      end: 20.0,
      size: 10.0,
      start: 0
    }
};
var data = [trace];
Plotly.newPlot('myDiv', data);
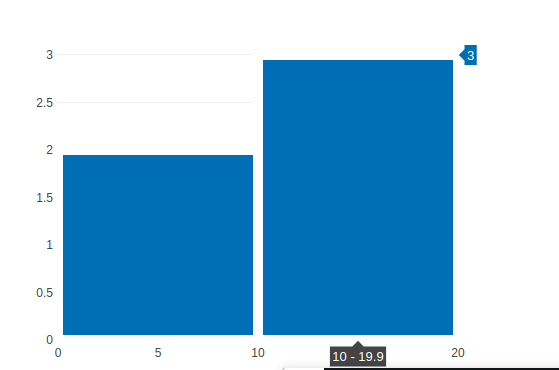
This is the result of using the notation [a; b) when creating groups. This behavior creates a problem, for example, when you want to dynamically adjust the bin size depending on the step. Here is an example:
var data = [1.0, 9.1, 10.0, 17.8, 18.5, 20.0];

step = 1.0; // any value from the interval: [0; 1]

xbins_start = data.reduce((x, y) => Math.min(x, y), 0.0);
xbins_end   = data.reduce((x, y) => Math.max(x, y), 0.0);
xbins_size  = (step * (xbins_end - xbins_start));

var trace = {
    x: data,
    type: 'histogram',
    autobinx: false,
    xbins: {
      start: xbins_start,
      end: xbins_end,
      size: xbins_size
    }
};

Plotly.newPlot('myDiv', [trace]);
By setting the step size to 1, I hope to get the only one group containing all the data values (the height of the bin should be 6), instead I get a height of 5 with the loss of the maximum value.

Beitragsleitfaden
Erste Schritte
- Lies das ganze Issue und danach den Beitragsleitfaden des Projekts.
- Schreib ins Issue, dass du es übernimmst — das erspart doppelte Arbeit.
- Forke das Repository und arbeite in einem Branch.
- Öffne einen Pull Request, der die Issue-Nummer nennt.
Rechercherichtung
Beginne mit der JavaScript-Reproduktion im Issue und verfolge den Histogramm-Binning-Pfad für explizit gesetzte xbins-Werte für start, end und size. Überprüfe das Grenzverhalten anhand der bereitgestellten Daten und bestätige, dass ein Wert, der gleich end ist, im resultierenden Bin gezählt wird.
Vom Indexierungsmodell aus dem Issue-Text verfasst.
Bewertung
- Tech-Stack
- javascript
- Bereich
- data-visualization
- Issue-Typ
- Bug
- Schwierigkeit
- 3/5
- Geschätzter Aufwand
- 1-2 Tage
- Aktivitätsstatus
- Veraltet
- Klarheit
- Größtenteils klar
- Anfängerfreundlichkeit
- 35/100