unexpected histogram bin size behavior
未关闭
还没有人认领这个 Issue。
bug
P3
- 主要语言
- JavaScript
- 星标
- 18.3k
- 派生
- 2k
- 平均合并
- 2 天 12 小时
- 30 天内合并 PR
- 28
描述
If the maximum number in the interval is a multiple of the bin size, then this number is lost.
Here is a code example:
var x = [1.0, 9.1, 10.0, 17.8, 18.5, 20.0];

var trace = {
    x: x,
    type: 'histogram',
    autobinx: false,
    xbins: {
      end: 20.0,
      size: 10.0,
      start: 0
    }
};
var data = [trace];
Plotly.newPlot('myDiv', data);
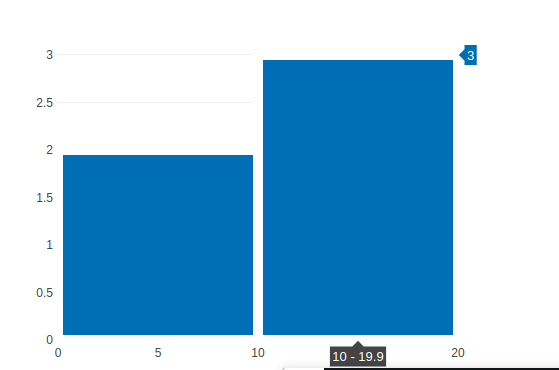
This is the result of using the notation [a; b) when creating groups. This behavior creates a problem, for example, when you want to dynamically adjust the bin size depending on the step. Here is an example:
var data = [1.0, 9.1, 10.0, 17.8, 18.5, 20.0];

step = 1.0; // any value from the interval: [0; 1]

xbins_start = data.reduce((x, y) => Math.min(x, y), 0.0);
xbins_end   = data.reduce((x, y) => Math.max(x, y), 0.0);
xbins_size  = (step * (xbins_end - xbins_start));

var trace = {
    x: data,
    type: 'histogram',
    autobinx: false,
    xbins: {
      start: xbins_start,
      end: xbins_end,
      size: xbins_size
    }
};

Plotly.newPlot('myDiv', [trace]);
By setting the step size to 1, I hope to get the only one group containing all the data values (the height of the bin should be 6), instead I get a height of 5 with the loss of the maximum value.

贡献指南
从这里开始
- 先读完整个 Issue,再读项目的贡献指南。
- 在 Issue 下留言说明你要接手 —— 这能避免两个人做同样的事。
- Fork 仓库,在一个分支上完成修改。
- 提交 Pull Request,并在描述里引用这个 Issue 编号。
调研方向
从 issue 中的 JavaScript 复现开始,跟踪显式 xbins start、end 和 size 值的直方图分箱路径。使用提供的数据验证边界行为,并确认等于 end 的值会被计入生成的 bin 中。
由索引模型根据 Issue 内容生成。
评估
- 技术栈
- javascript
- 领域
- data-visualization
- Issue 类型
- 缺陷
- 难度
- 3/5
- 预计耗时
- 1-2 天
- 活跃度
- 停滞
- 描述清晰度
- 基本清楚
- 新手友好度
- 35/100