Visual artefacts on filled area plot + wrong axis on stackgroup
Nadie ha tomado este issue todavía.
- Lenguaje dominante
- JavaScript
- Estrellas
- 18.3k
- Forks
- 2k
- Merge medio
- 2 d 12 h
- PR fusionados (30 d)
- 28
Descripción
Hello!
I've found a (two?) bug(s) while trying to visualize a filled area around a line!
I tested two approaches, one with stackgroups
https://jsfiddle.net/tuzqayeo/
var data = [
    {
      "x": [
        1,2,3,4,5,6,7,8
      ],
      "y": [
        -7.9697220089372856, -2.627365584280772, 7.593901896848809,
        7.593901896848809, 8.368216650109318, 36.78414802092127,
        53.936836616548824, 290.74225043249953
      ],
      "name": "1",
      "marker": { "color": "rgb(0,128,255)" },
      stackgroup: 'one',
      type: "scatter"
    },
    {
      "x": [
         1,2,3,4,5,6,7,8
      ],
      "y": [
        -12.176146295932956, -6.236001952326675, 3.815685614756825,3.815685614756825, 3.420446004767763, 19.39126823156141, 26.148107026147827, -75.03836092933072
      ],
      "name": "2",
      "marker": { "color": "rgb(0,128,255)" },
      stackgroup: 'one',
      fillcolor: "rgba(255,255,255,0)",
      type: "scatter"
    },
    {
      "x": [
         1,2,3,4,5,6,7,8
      ],
      "y": [
        -10.097532455267322, -4.448717940300206, 5.687911765670939,
        5.687911765670939, 5.86543013985068, 27.792147279053925,
        39.35149995881291, -1.239851028073491
      ],
      "name": "3",
      "marker": { "color": "rgb(0,128,255)" },
      "type": "scatter",
    }
  ];

var layout = {}

Plotly.newPlot('myDiv', data, layout);
and one with a fill->toself line that wraps around itself:
https://jsfiddle.net/qocs8nxz/
var data = [
   {
      "x": [
         1,2,3,4,5,6,7,8,8,7,6,5,4,3,2,1
      ],
      "y": [
        -7.9697220089372856, -2.627365584280772, 7.593901896848809,
        7.593901896848809, 8.368216650109318, 36.78414802092127,
        53.936836616548824, 290.74225043249953, -75.03836092933072,
        26.148107026147827, 19.39126823156141, 3.420446004767763,
        3.815685614756825, 3.815685614756825, -6.236001952326675,
        -12.176146295932956
      ],
      "name": "1-2",
      "marker": { "color": "rgba(255,255,255,0)" },
      "type": "scatter",
      "fill": "toself",
      "fillcolor": "rgba(0,100,80,0.2)",
    },
    {
      "x": [
         1,2,3,4,5,6,7,8
      ],
      "y": [
        -10.097532455267322, -4.448717940300206, 5.687911765670939,
        5.687911765670939, 5.86543013985068, 27.792147279053925,
        39.35149995881291, -1.239851028073491
      ],
      "name": "3",
      "marker": { "color": "rgb(0,128,255)" },
      "type": "scatter",
    }
  ];

var layout = {}

Plotly.newPlot('myDiv', data, layout);
in both cases the HTML is simply
<head>
  <script src="https://cdn.plot.ly/plotly-latest.min.js"></script>
</head>

<body>
  <div id="myDiv"></div>
</body>
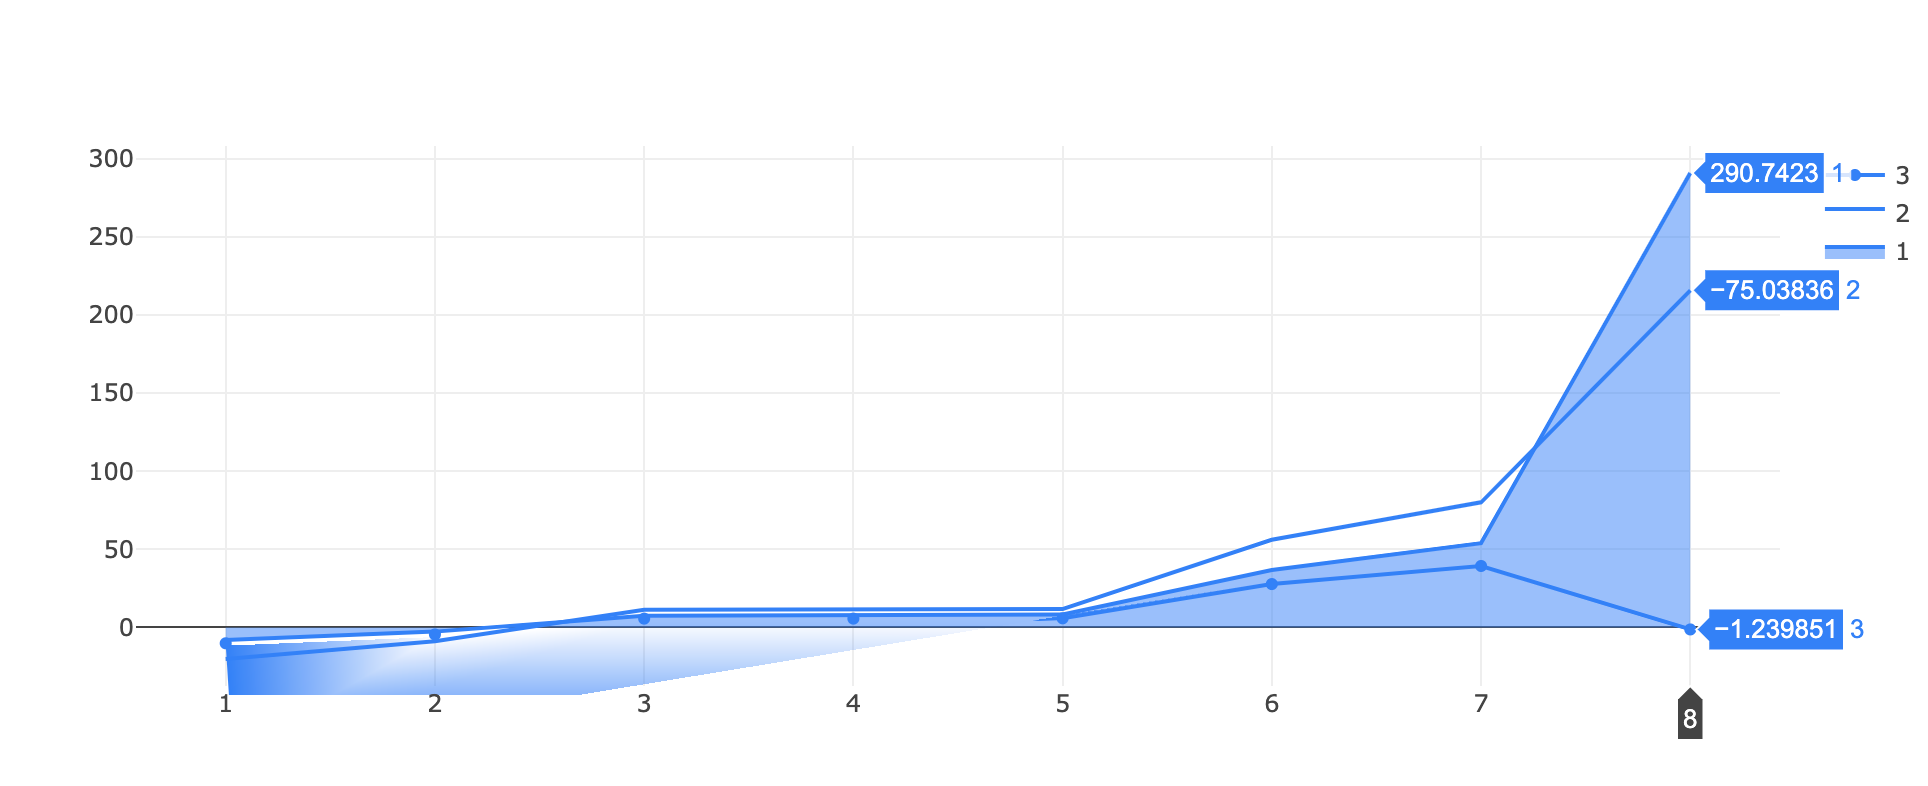
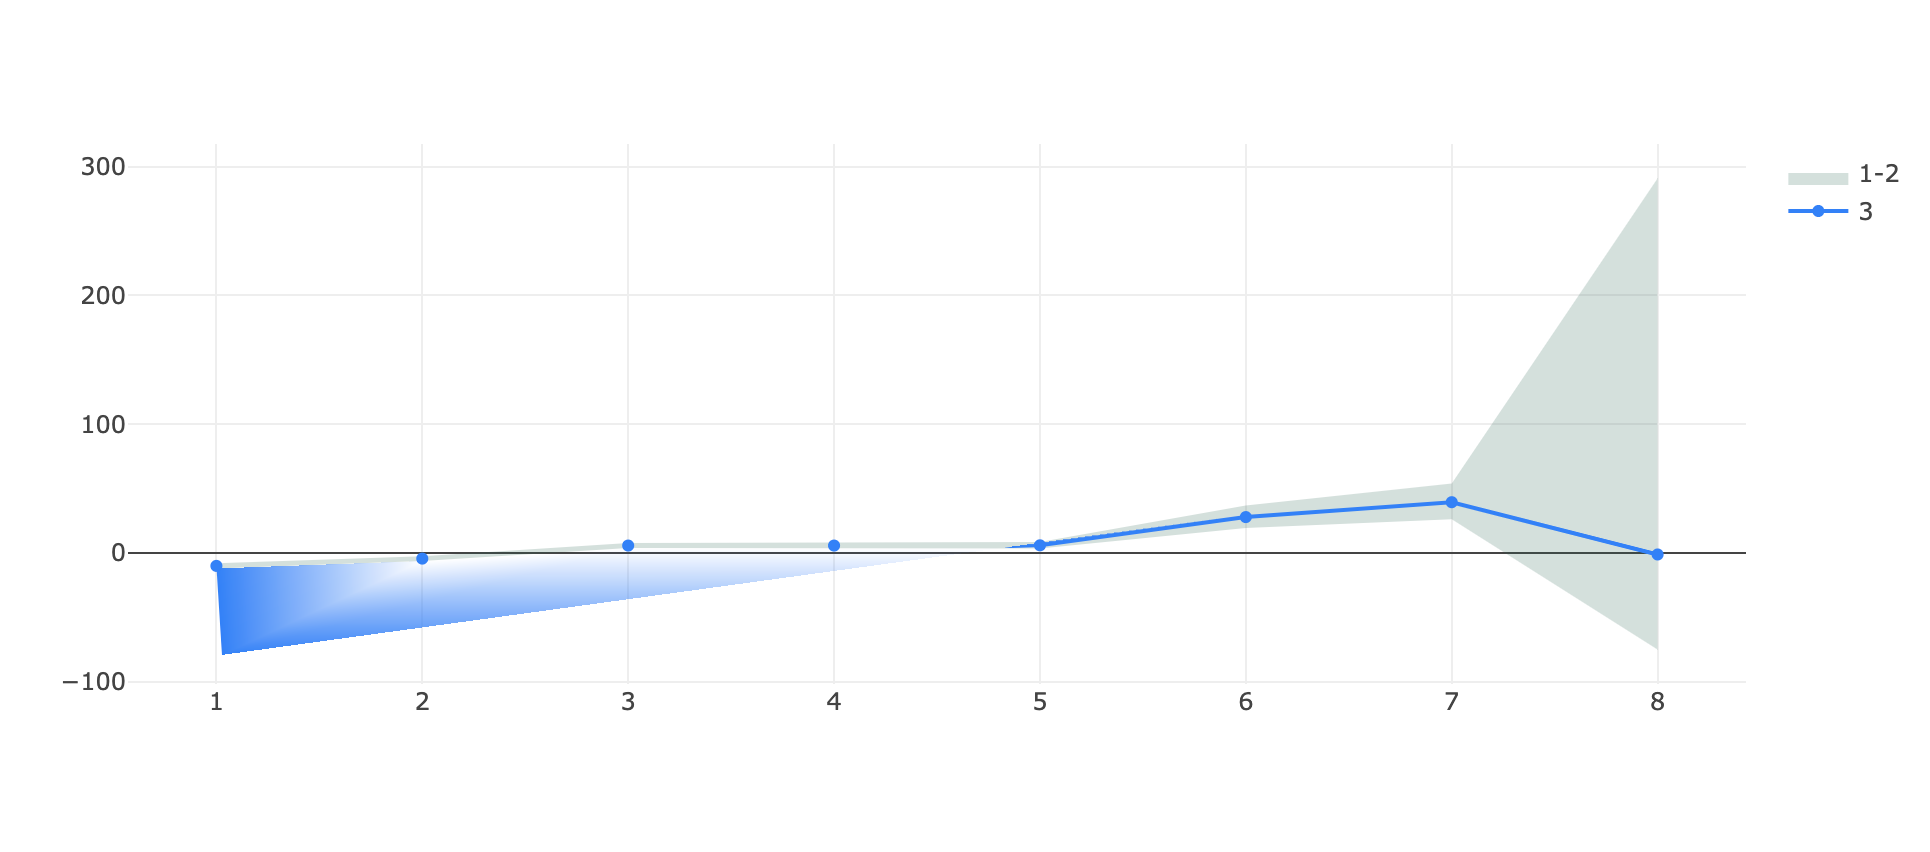
What I obtain in both cases is a visual artefact on the bottom at the start of the graph, the single line appears teared!
(in the first example there's also an issue of scale on the same y axis for the stacked group and the single line, where -75 is above -1 🤔)
It appears to be linked to the range of the graph since if I zoom vertically on a portion of the graph the issue disappear and even if I substitute the ~290 in each plot with like ~90 (so effectively decreasing the y range of the autorange plot) the issue disappear.
Let me know if more details are needed, any help is appreciated.
and with the scale reduced:

Guía de contribución
Primeros pasos
- Lee el issue completo y luego la guía de contribución del proyecto.
- Comenta en el issue que vas a ocuparte — evita que dos personas hagan lo mismo.
- Haz un fork del repositorio y trabaja en una rama.
- Abre un pull request que haga referencia al número del issue.
Línea de trabajo
Reproduce ambos casos de jsfiddle proporcionados mediante Plotly.newPlot, comprobando primero el artefacto del área rellena y después la escala del eje de stackgroup. Compara el comportamiento al hacer zoom vertical y con valores reducidos, tal como se describe. La tarea estará terminada cuando los artefactos hayan desaparecido y el grupo apilado y la línea individual compartan la escala correcta del eje y en todos los rangos indicados.
Escrito por el modelo de indexación a partir del texto del issue.
Evaluación
- Stack tecnológico
- javascript
- Área
- data-visualization
- Tipo de issue
- Error
- Dificultad
- 4/5
- Tiempo estimado
- 3-5 días
- Estado de actividad
- Estancado
- Claridad
- Bastante claro
- Aptitud para principiantes
- 35/100