Pie Chart Misalignment Issue when resizing the browser window
Chưa có ai nhận issue này.
- Ngôn ngữ chính
- JavaScript
- Star
- 18.3k
- Fork
- 2k
- Merge trung bình
- 2 ngày 12 giờ
- Pull request đã merge (30 ngày)
- 28
Mô tả
A misalignment issue was observed when resizing on a donut pie chart. The centers of the circles are misaligned after resizing the browser window.(multiple times of resizing are needed to reproduce this issue)
The original nest pie chat:(linke to codepen: https://codepen.io/runqi-han/pen/JjNGQZx)
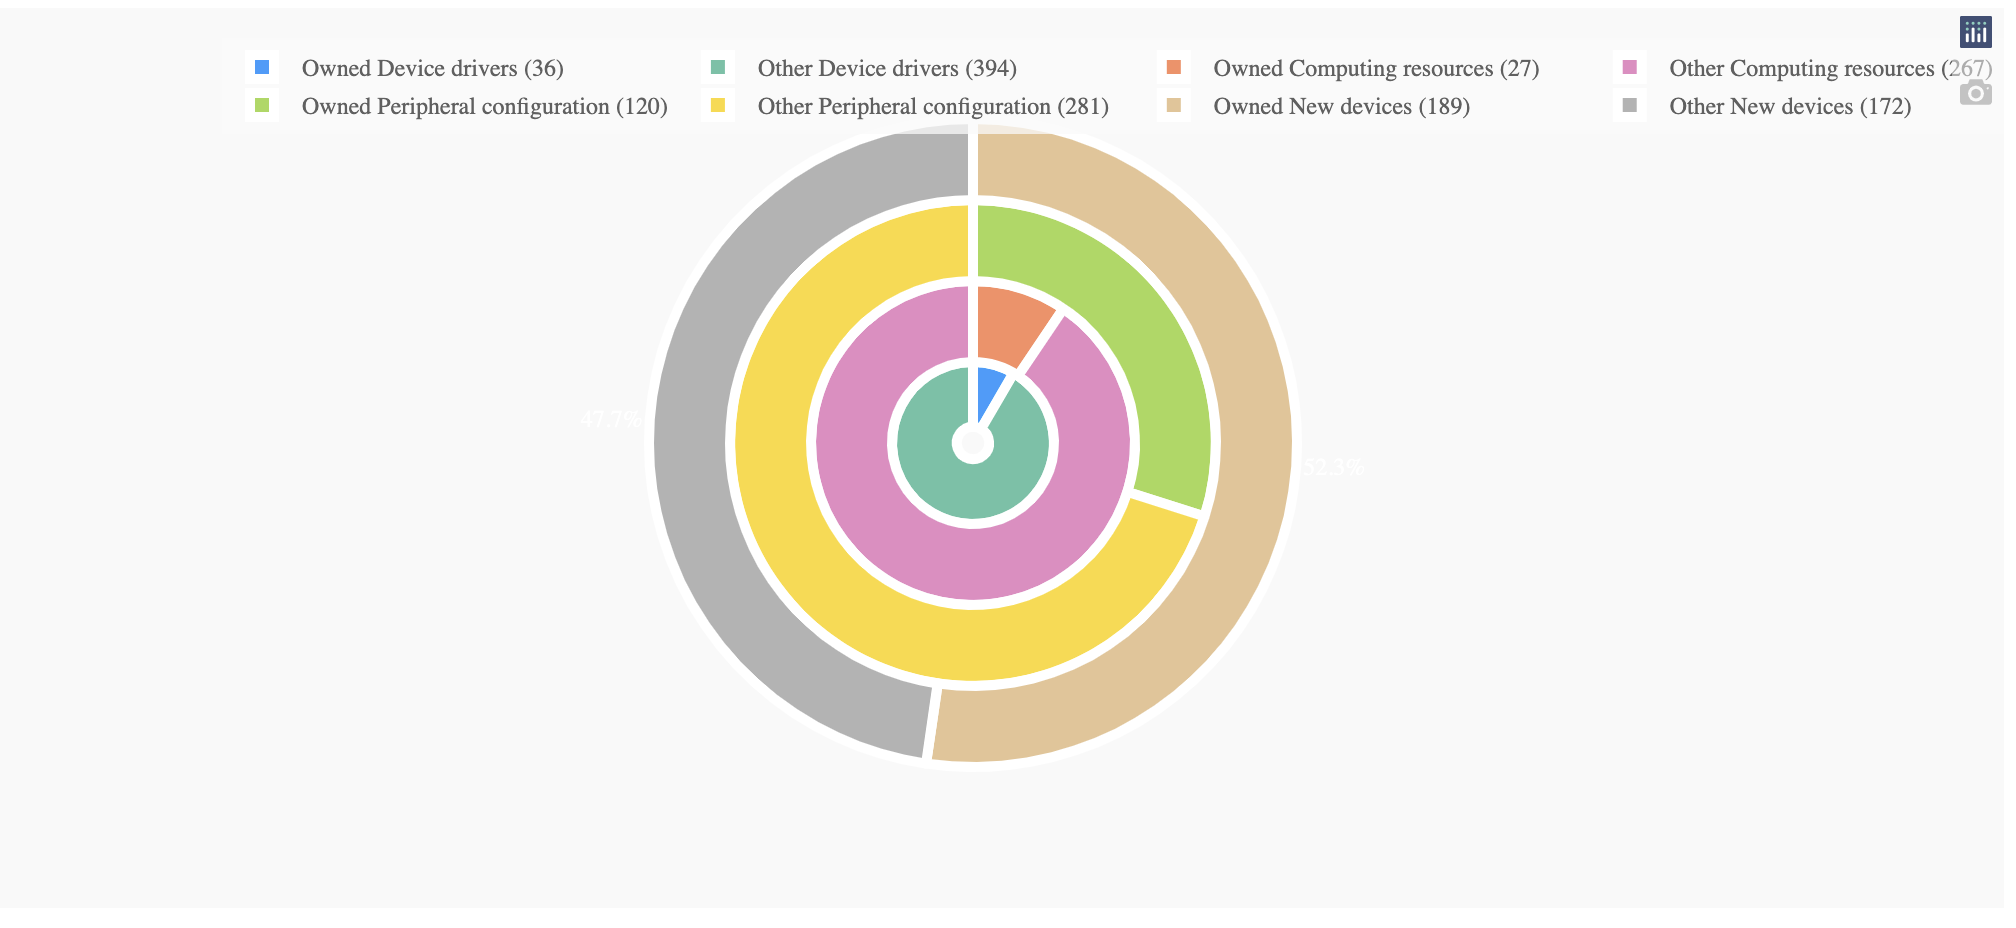
After resizing the browser n times (n>10)

The issue can be removed by removing textinfo='none' property in the pie chat.
Below is the code used to reproduce the graph(with Dash).
import dash
import dash_design_kit as ddk
import dash_core_components as dcc
import dash_html_components as html
from dash.dependencies import Input, Output
import plotly.express as px
import plotly.graph_objs as go
import numpy as np
import random

app = dash.Dash(__name__)
groups = ["Device Drivers", "Computing Resources", "Peripheral Configuration", "New Devices"]
fig = go.Figure()

holes = [0.2, 0.5, 2/3, 0.75]
domain = [[0.4, 0.6], [0.3, 0.7], [0.2, 0.8], [0.1, 0.9]]
prob = np.random.random(len(groups))
prob = prob/sum(prob)
prob = sorted(prob)
direction = "clockwise"
for i in range(0, len(prob)):
    count = random.randint(250, 500)
    data = [prob[i], 1 - prob[i]]
    soft_type = groups[i]
    trace = go.Pie(
        hole=holes[i],
        domain={"x": domain[i],
                "y": domain[i]},
        values=data,
        direction=direction,
        sort=False,
        hovertext=[int(count*prob[i]), int(count*(1-prob[i]))],
        hoverinfo="label+percent",
        labels=[f"Owned {str.capitalize(soft_type)} ({int(count*prob[i])})",
                f"Other {str.capitalize(soft_type)} ({int(count*(1-prob[i]))})",
                ],
        textinfo='none',
        #textfont_color='white',
        textposition='outside',
        marker={'line': {'color': 'white', 'width': 5}},
        showlegend=True
    )
    direction = "counterclockwise" if direction == "clockwise" else "clockwise"
    fig.add_trace(trace)
fig.update_layout(
    legend=dict(
        orientation="h",
        yanchor="bottom",
        y=-0.45,
        xanchor="left",
        x=0,
        itemclick="toggle"
    ),
    showlegend=True,
)

app.layout = ddk.App([
    ddk.Row(children=[
        ddk.Card(width=100, children=ddk.Graph(figure=fig)),
    ])
])


if __name__ == '__main__':
    app.run_server(debug=True)
Hướng dẫn đóng góp
Bắt đầu từ đâu
- Đọc hết issue, rồi đọc hướng dẫn đóng góp của dự án.
- Bình luận trên issue rằng bạn sẽ nhận — tránh hai người làm cùng một việc.
- Fork repository và làm thay đổi trên một nhánh.
- Mở pull request có tham chiếu số hiệu của issue.
Hướng nghiên cứu
Bắt đầu với bản tái hiện Dash được cung cấp và CodePen được liên kết, sau đó liên tục thay đổi kích thước trình duyệt với các trace pie lồng nhau bằng cách sử dụng textinfo='none'. So sánh tâm của các hình tròn trước và sau khi thay đổi kích thước, đồng thời xác minh rằng các tâm vẫn thẳng hàng trong khi vẫn giữ nguyên hành vi biểu đồ đã được báo cáo.
Do mô hình lập chỉ mục viết ra từ nội dung của issue.
Đánh giá
- Công nghệ
- javascript, python
- Lĩnh vực
- data-visualization
- Loại issue
- Lỗi
- Độ khó
- 4/5
- Thời gian dự kiến
- 3-5 ngày
- Mức độ hoạt động
- Đình trệ
- Độ rõ ràng
- Khá rõ ràng
- Mức phù hợp với người mới
- 42/100