Pie Chart Misalignment Issue when resizing the browser window
Personne n'a encore pris cette issue.
- Langage dominant
- JavaScript
- Étoiles
- 18.3k
- Forks
- 2k
- Merge moyen
- 2 j 12 h
- PR mergées (30 j)
- 28
Description
A misalignment issue was observed when resizing on a donut pie chart. The centers of the circles are misaligned after resizing the browser window.(multiple times of resizing are needed to reproduce this issue)
The original nest pie chat:(linke to codepen: https://codepen.io/runqi-han/pen/JjNGQZx)
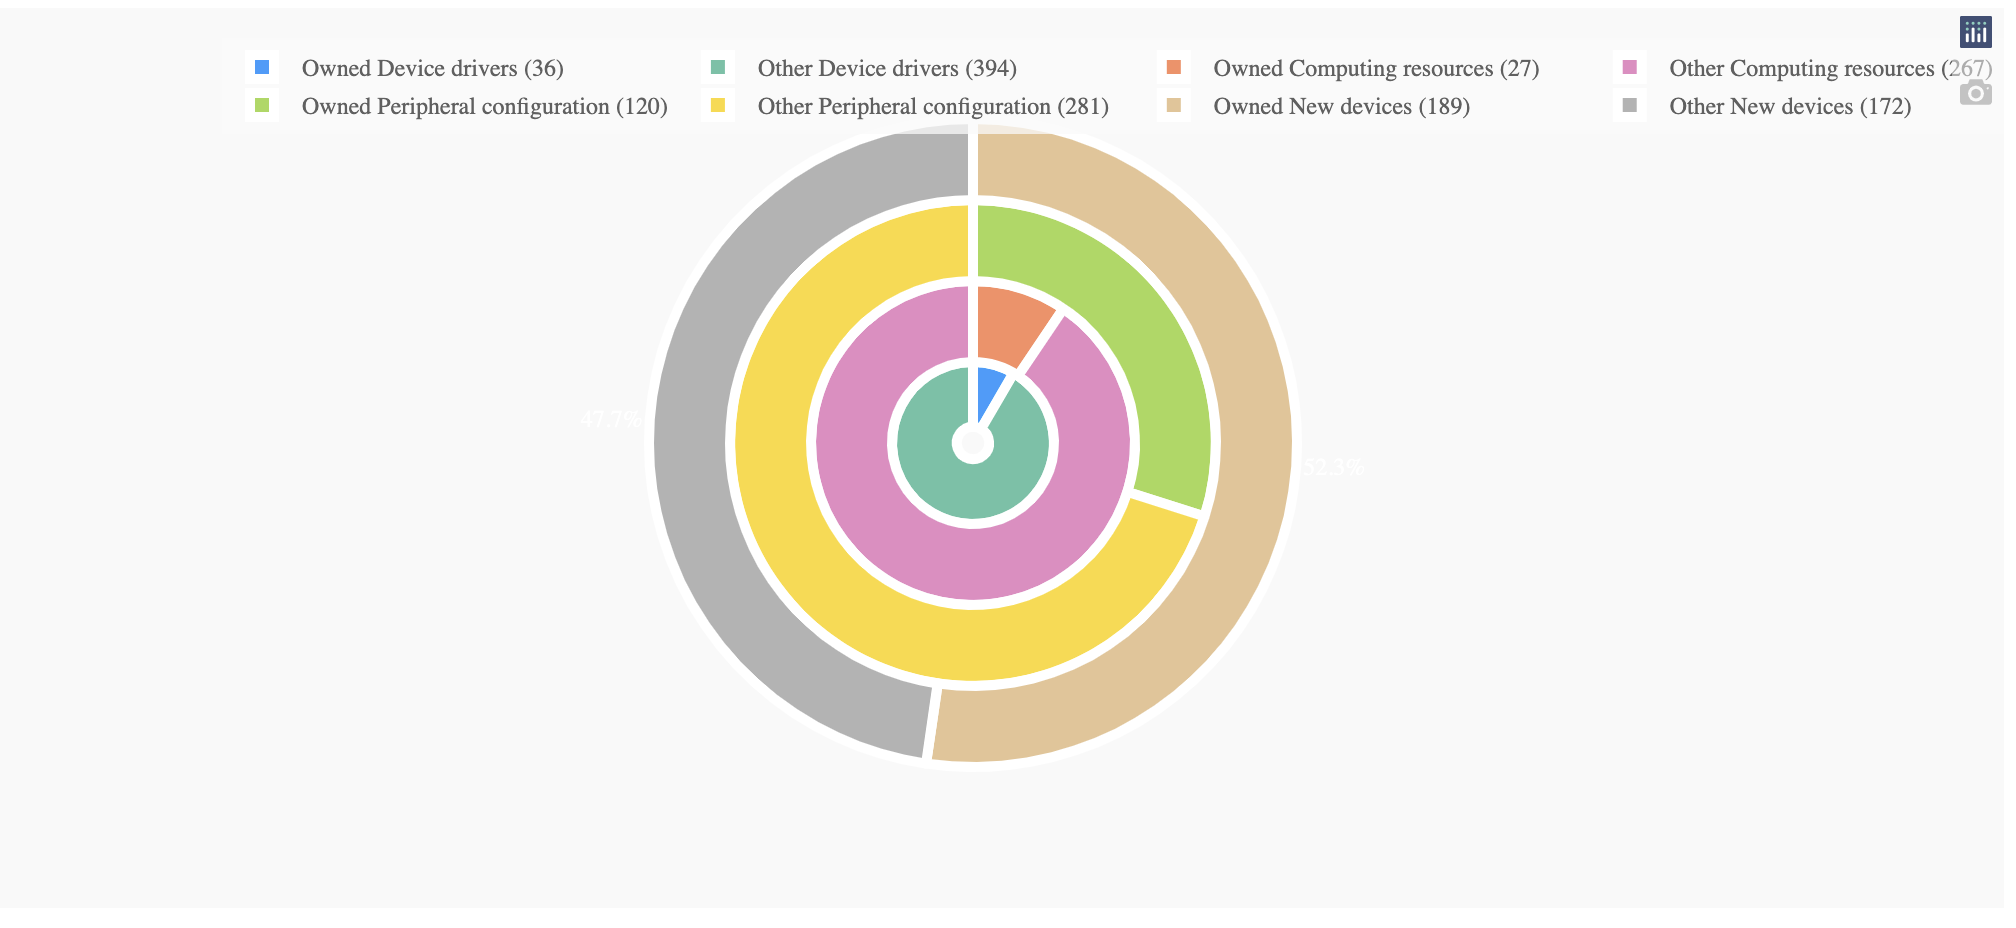
After resizing the browser n times (n>10)

The issue can be removed by removing textinfo='none' property in the pie chat.
Below is the code used to reproduce the graph(with Dash).
import dash
import dash_design_kit as ddk
import dash_core_components as dcc
import dash_html_components as html
from dash.dependencies import Input, Output
import plotly.express as px
import plotly.graph_objs as go
import numpy as np
import random

app = dash.Dash(__name__)
groups = ["Device Drivers", "Computing Resources", "Peripheral Configuration", "New Devices"]
fig = go.Figure()

holes = [0.2, 0.5, 2/3, 0.75]
domain = [[0.4, 0.6], [0.3, 0.7], [0.2, 0.8], [0.1, 0.9]]
prob = np.random.random(len(groups))
prob = prob/sum(prob)
prob = sorted(prob)
direction = "clockwise"
for i in range(0, len(prob)):
    count = random.randint(250, 500)
    data = [prob[i], 1 - prob[i]]
    soft_type = groups[i]
    trace = go.Pie(
        hole=holes[i],
        domain={"x": domain[i],
                "y": domain[i]},
        values=data,
        direction=direction,
        sort=False,
        hovertext=[int(count*prob[i]), int(count*(1-prob[i]))],
        hoverinfo="label+percent",
        labels=[f"Owned {str.capitalize(soft_type)} ({int(count*prob[i])})",
                f"Other {str.capitalize(soft_type)} ({int(count*(1-prob[i]))})",
                ],
        textinfo='none',
        #textfont_color='white',
        textposition='outside',
        marker={'line': {'color': 'white', 'width': 5}},
        showlegend=True
    )
    direction = "counterclockwise" if direction == "clockwise" else "clockwise"
    fig.add_trace(trace)
fig.update_layout(
    legend=dict(
        orientation="h",
        yanchor="bottom",
        y=-0.45,
        xanchor="left",
        x=0,
        itemclick="toggle"
    ),
    showlegend=True,
)

app.layout = ddk.App([
    ddk.Row(children=[
        ddk.Card(width=100, children=ddk.Graph(figure=fig)),
    ])
])


if __name__ == '__main__':
    app.run_server(debug=True)
Guide de contribution
Ouvrir le guide de contribution
Par où commencer
- Lisez l'issue en entier, puis le guide de contribution du projet.
- Signalez en commentaire que vous la prenez — cela évite que deux personnes fassent le même travail.
- Forkez le dépôt et travaillez sur une branche.
- Ouvrez une pull request qui référence le numéro de l'issue.
Piste de recherche
Commencez par la reproduction Dash fournie et le CodePen associé, puis redimensionnez plusieurs fois le navigateur avec des traces pie imbriquées utilisant textinfo='none'. Comparez les centres des cercles avant et après le redimensionnement et vérifiez que les centres restent alignés tout en conservant le comportement du graphique signalé.
Rédigé par le modèle d'indexation à partir du texte de l'issue.
Évaluation
- Stack technique
- javascript, python
- Domaine
- data-visualization
- Type d'issue
- Bug
- Difficulté
- 4/5
- Temps estimé
- 3-5 jours
- Activité
- À l'abandon
- Clarté
- Plutôt claire
- Accessibilité débutants
- 42/100