Pie Chart Misalignment Issue when resizing the browser window
未關閉
還沒有人認領這個 Issue。
bug
P3
- 主要語言
- JavaScript
- 星號
- 18.3k
- 分支
- 2k
- 平均合併
- 2 天 12 小時
- 30 天內合併 PR
- 28
描述
A misalignment issue was observed when resizing on a donut pie chart. The centers of the circles are misaligned after resizing the browser window.(multiple times of resizing are needed to reproduce this issue)
The original nest pie chat:(linke to codepen: https://codepen.io/runqi-han/pen/JjNGQZx)
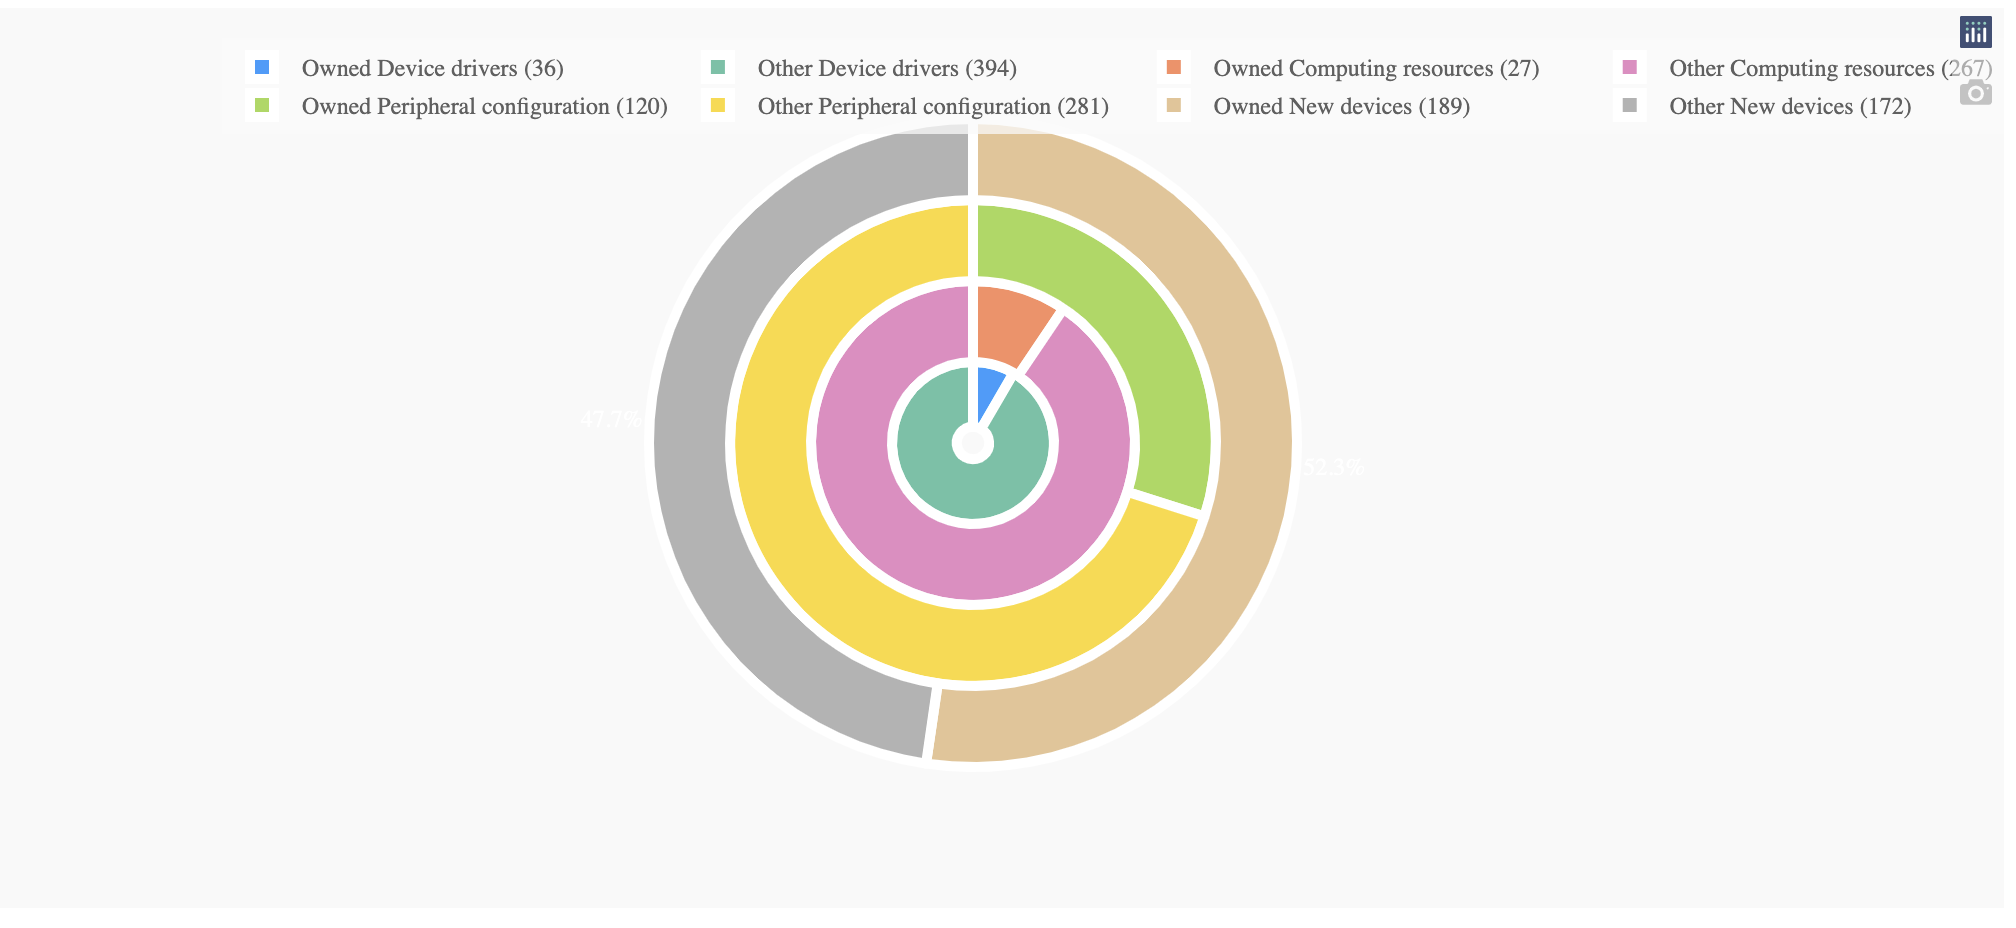
After resizing the browser n times (n>10)

The issue can be removed by removing textinfo='none' property in the pie chat.
Below is the code used to reproduce the graph(with Dash).
import dash
import dash_design_kit as ddk
import dash_core_components as dcc
import dash_html_components as html
from dash.dependencies import Input, Output
import plotly.express as px
import plotly.graph_objs as go
import numpy as np
import random

app = dash.Dash(__name__)
groups = ["Device Drivers", "Computing Resources", "Peripheral Configuration", "New Devices"]
fig = go.Figure()

holes = [0.2, 0.5, 2/3, 0.75]
domain = [[0.4, 0.6], [0.3, 0.7], [0.2, 0.8], [0.1, 0.9]]
prob = np.random.random(len(groups))
prob = prob/sum(prob)
prob = sorted(prob)
direction = "clockwise"
for i in range(0, len(prob)):
    count = random.randint(250, 500)
    data = [prob[i], 1 - prob[i]]
    soft_type = groups[i]
    trace = go.Pie(
        hole=holes[i],
        domain={"x": domain[i],
                "y": domain[i]},
        values=data,
        direction=direction,
        sort=False,
        hovertext=[int(count*prob[i]), int(count*(1-prob[i]))],
        hoverinfo="label+percent",
        labels=[f"Owned {str.capitalize(soft_type)} ({int(count*prob[i])})",
                f"Other {str.capitalize(soft_type)} ({int(count*(1-prob[i]))})",
                ],
        textinfo='none',
        #textfont_color='white',
        textposition='outside',
        marker={'line': {'color': 'white', 'width': 5}},
        showlegend=True
    )
    direction = "counterclockwise" if direction == "clockwise" else "clockwise"
    fig.add_trace(trace)
fig.update_layout(
    legend=dict(
        orientation="h",
        yanchor="bottom",
        y=-0.45,
        xanchor="left",
        x=0,
        itemclick="toggle"
    ),
    showlegend=True,
)

app.layout = ddk.App([
    ddk.Row(children=[
        ddk.Card(width=100, children=ddk.Graph(figure=fig)),
    ])
])


if __name__ == '__main__':
    app.run_server(debug=True)
貢獻指南
從這裡開始
- 先讀完整個 Issue,再讀專案的貢獻指南。
- 在 Issue 下留言說明你要接手 —— 這能避免兩個人做同樣的事。
- Fork 儲存庫,在一個分支上完成修改。
- 送出 Pull Request,並在描述裡引用這個 Issue 編號。
研究方向
從提供的 Dash 重現和連結的 CodePen 開始,然後使用 textinfo='none' 的巢狀 pie 軌跡反覆調整瀏覽器大小。比較調整大小前後的圓心,並驗證圓心在保留所回報的圖表行為的同時仍然對齊。
由索引模型根據 Issue 內容生成。
評估
- 技術堆疊
- javascript, python
- 領域
- data-visualization
- Issue 類型
- 缺陷
- 難度
- 4/5
- 預估耗時
- 3-5 天
- 活躍度
- 停滯
- 描述清晰度
- 基本清楚
- 新手友好度
- 42/100