Customdata format variations
オープン
まだ誰も着手していません。
- 主要言語
- R
- スター
- 2.7k
- フォーク
- 641
- PR マージ指標
- 30日以内にマージされた PR はありません
説明
There seems to be a lot of variations regarding the format in which the customdata is structured.
Showcase:
library(plotly)
library(htmlwidgets)

js <- "function(el, x) {
         el.on('plotly_click', function(d) {
           console.log(d);
           console.log(d.points[0].data.customdata[0]);
       });
       }"

X <- data.frame(x = c(1, 2, 1, 2), y = c(1, 1, 2, 2), z = as.character(1:4), mydata = letters[1:4])

gg <- ggplot(X, aes(x = x, y = y, customdata = mydata)) + geom_tile(aes(fill = z))

ggplotly(gg) %>% onRender(js)
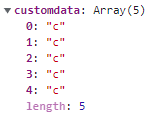
Same as above, except z is now numerical:
X <- data.frame(x = c(1, 2, 1, 2), y = c(1, 1, 2, 2), z = 1:4, mydata = letters[1:4])
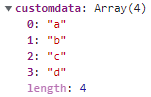
More information in this Stackoverflow post.
コントリビューションガイド
はじめの一歩
- issue を最後まで読み、次にプロジェクトのコントリビューションガイドを読みます。
- 着手することを issue にコメントします — 二人が同じ作業をするのを防げます。
- リポジトリをフォークし、ブランチを切って変更します。
- issue 番号を参照したプルリクエストを送ります。
調査の方向性
まず ggplotly() と htmlwidgets::onRender() を使用して 2 つの R の例を再現し、その後 plotly_click コールバックで受け取る customdata を調べます。この issue では対象ファイルやテストが指定されておらず、望ましい一貫した形式も定義されていないため、実装前に期待される動作を確立する必要があります。
索引モデルが issue の本文から書いたものです。
評価
- 技術スタック
- javascript, r
- 領域
- data-visualization
- issue の種類
- バグ
- 難易度
- 4/5
- 見積もり時間
- 3〜5日
- 活発さ
- 停滞
- 明瞭さ
- 説明が足りない
- 初心者へのやさしさ
- 35/100