Customdata format variations
未关闭
还没有人认领这个 Issue。
- 主要语言
- R
- 星标
- 2.7k
- 派生
- 641
- PR 合并指标
- 30 天内没有已合并 PR
描述
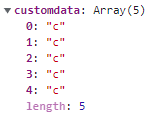
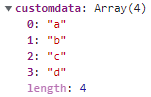
There seems to be a lot of variations regarding the format in which the customdata is structured.
Showcase:
library(plotly)
library(htmlwidgets)

js <- "function(el, x) {
         el.on('plotly_click', function(d) {
           console.log(d);
           console.log(d.points[0].data.customdata[0]);
       });
       }"

X <- data.frame(x = c(1, 2, 1, 2), y = c(1, 1, 2, 2), z = as.character(1:4), mydata = letters[1:4])

gg <- ggplot(X, aes(x = x, y = y, customdata = mydata)) + geom_tile(aes(fill = z))

ggplotly(gg) %>% onRender(js)
Same as above, except z is now numerical:
X <- data.frame(x = c(1, 2, 1, 2), y = c(1, 1, 2, 2), z = 1:4, mydata = letters[1:4])
More information in this Stackoverflow post.
贡献指南
从这里开始
- 先读完整个 Issue,再读项目的贡献指南。
- 在 Issue 下留言说明你要接手 —— 这能避免两个人做同样的事。
- Fork 仓库,在一个分支上完成修改。
- 提交 Pull Request,并在描述里引用这个 Issue 编号。
调研方向
先使用 ggplotly() 和 htmlwidgets::onRender() 重现两个 R 示例,然后检查 plotly_click 回调中接收到的 customdata。该 issue 未指定目标文件或测试,也未定义所需的一致格式,因此需要在实现之前确定预期行为。
由索引模型根据 Issue 内容生成。
评估
- 技术栈
- javascript, r
- 领域
- data-visualization
- Issue 类型
- 缺陷
- 难度
- 4/5
- 预计耗时
- 3-5 天
- 活跃度
- 停滞
- 描述清晰度
- 需要澄清
- 新手友好度
- 35/100