Displaying Hebrew and RTL Languages
Open
Nobody has claimed this yet.
- Dominant language
- R
- Stars
- 2.7k
- Forks
- 641
- PR merge metrics
- No merged PRs in 30d
Description
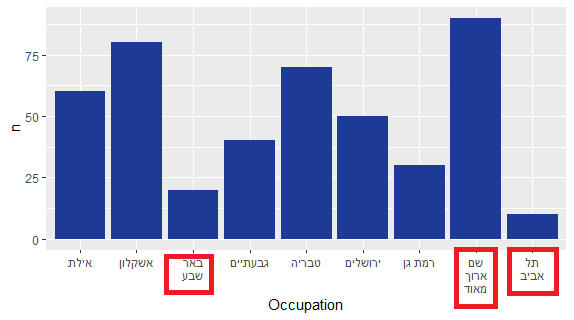
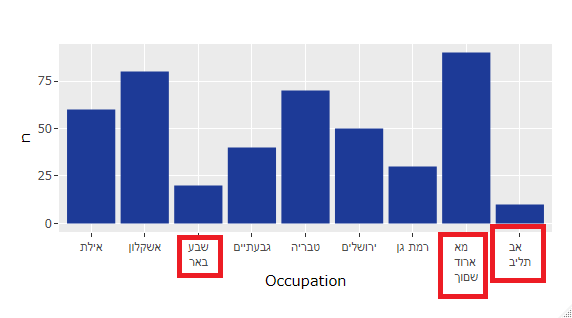
Although ggplotly does display Hebrew text correctly, when I try to use str_wrap or other means to wrap titles, it doesnt display the text properly. It appears to wrap the text incorrectly, breaking the sentence up at the wrong points.
Heres a minimal working example:
library(plotly)
# DB
Occupation = c("תל אביב", "באר שבע", "רמת גן", "גבעתיים", "ירושלים", "אילת", "טבריה", "אשקלון", "שם ארוך מאוד")
df <- as.data.frame(Occupation) %>%
  mutate(n = row_number()*10)

df$Occupation <- str_wrap(df$Occupation, width = 6) %>% as.factor()

# PLOT
plot <- df %>% ggplot(aes(x = Occupation, y = n)) +
  geom_col()

ggplotly(plot)
ggplot:
ggplotly:
Contributor guide
First steps
- Read the whole issue, then the project's contributing guide.
- Comment on the issue to say you are picking it up — it saves two people doing the same work.
- Fork the repository and make your change on a branch.
- Open a pull request that references the issue number.
Research direction
Start with the minimal R example using str_wrap, ggplot, and ggplotly, and compare the ggplot and ggplotly screenshots for the Hebrew labels. Reproduce the incorrect wrapping and investigate the ggplotly rendering path; done means Hebrew and other RTL titles wrap at the correct points in the interactive plot.
Written by the indexing model from the issue text.
Assessment
- Tech stack
- r
- Domain
- data-visualization
- Issue type
- Bug
- Difficulty
- 3/5
- Estimated time
- 1-2 days
- Activity status
- Stale
- Clarity
- Mostly clear
- Newbie friendliness
- 42/100