Plot does not show hoverinfo for first data point when default hovermode or set to 'closest'
Nobody has claimed this yet.
- Dominant language
- R
- Stars
- 2.7k
- Forks
- 641
- PR merge metrics
- No merged PRs in 30d
Description
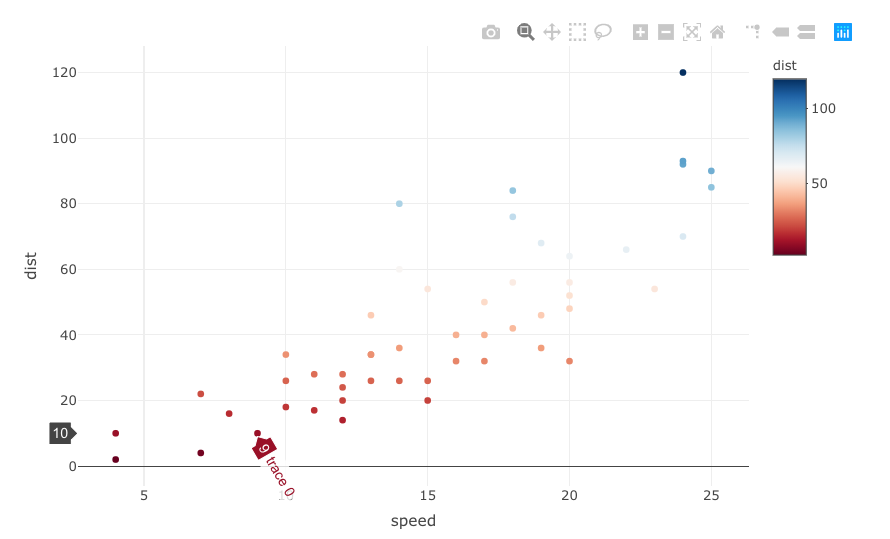
As written in the title, the hoverinfo for the first (bottom left) data point when layout.hovermode= 'closest' or kept as default does not appear.
# call library
library(plotly)

# reset fig
fig <- NULL

# add an extra line to check behavior on right hand side of graph
cars_one_extra_line <- rbind(cars,c(25,90))

# plot
fig <- plot_ly(cars_one_extra_line)
fig <- fig %>% add_trace(x = ~speed,
                         y = ~dist,
                         color = ~dist,
                         colors = 'RdBu',
                         type = 'scatter',
                         mode = 'markers')
fig <- fig %>% layout(hovermode = "closest")
fig
This is shown in the screenshot below. If the cursor is moved to the point above, the hoverinfo appears.

In an effort to understand the behavior, I also tried other tags. Strangely, the hovermode = 'y' also seems to have a weird behavior. Things to note are the following:
- text is tilted,
- text is sometimes obscured beyond the viewing frame (not shown in this example but does occur in certain cases),
- text is sometimes shown twice but in two places,
- y axis position is not always shown (for points at the top and bottom of the chart)

Contributor guide
First steps
- Read the whole issue, then the project's contributing guide.
- Comment on the issue to say you are picking it up — it saves two people doing the same work.
- Fork the repository and make your change on a branch.
- Open a pull request that references the issue number.
Research direction
Run the provided R reproduction with plot_ly, scatter markers, and hovermode set to "closest" or "y" to confirm the missing and malformed hover behavior. Trace the hover rendering path used by the R package and its interactive graph output; done means the first point displays hoverinfo and the reported hovermode cases render consistently without clipping, duplication, or missing axis positions.
Written by the indexing model from the issue text.
Assessment
- Tech stack
- r
- Domain
- data-visualization, frontend
- Issue type
- Bug
- Difficulty
- 4/5
- Estimated time
- 3-5 days
- Activity status
- Stale
- Clarity
- Mostly clear
- Newbie friendliness
- 38/100