Sankey labels appear at strange locations
Nobody has claimed this yet.
- Dominant language
- R
- Stars
- 2.7k
- Forks
- 641
- PR merge metrics
- No merged PRs in 30d
Description
In vertical sankeys, mouseover labels of flows appear at strange locations, some of them outside the drawing area.
See here:
library(plotly)
library(rjson)

json_file <- "https://raw.githubusercontent.com/plotly/plotly.js/master/test/image/mocks/sankey_energy.json"
json_data <- fromJSON(paste(readLines(json_file), collapse=""))

p <- plot_ly(
  type = "sankey",
  domain = list(
    x =  c(0,1),
    y =  c(0,1)
  ),
  orientation = "v", # this is the only change to the original example
  valueformat = ".0f",
  valuesuffix = "TWh",

  node = list(
    label = json_data$data[[1]]$node$label,
    color = json_data$data[[1]]$node$color,
    pad = 15,
    thickness = 15,
    line = list(
      color = "black",
      width = 0.5
    )
  ),

  link = list(
    source = json_data$data[[1]]$link$source,
    target = json_data$data[[1]]$link$target,
    value =  json_data$data[[1]]$link$value,
    label =  json_data$data[[1]]$link$label
  )
) %>%
  layout(
    title = "Energy forecast for 2050<br>Source: Department of Energy & Climate Change, Tom Counsell via <a href='https://bost.ocks.org/mike/sankey/'>Mike Bostock</a>",
    font = list(
      size = 10
    ),
    xaxis = list(showgrid = F, zeroline = F),
    yaxis = list(showgrid = F, zeroline = F)
  )
Result:
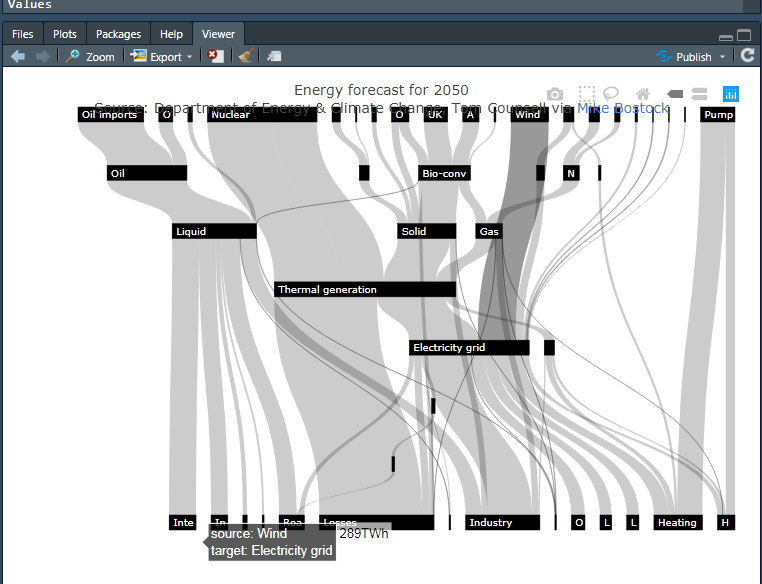
This is the mouseover of the flow currently shaded in dark grey. In general, labels of flows to the left of the plot appear at rather correct locations and labels of flows to the right of the plot are off or do not display at all.
> version
               _
platform       x86_64-w64-mingw32
arch           x86_64
os             mingw32
system         x86_64, mingw32
status
major          3
minor          6.1
year           2019
month          07
day            05
svn rev        76782
language       R
version.string R version 3.6.1 (2019-07-05)
nickname       Action of the Toes

> packageVersion("plotly")
[1] ‘4.9.1’
Contributor guide
First steps
- Read the whole issue, then the project's contributing guide.
- Comment on the issue to say you are picking it up — it saves two people doing the same work.
- Fork the repository and make your change on a branch.
- Open a pull request that references the issue number.
Research direction
Start by running the supplied R plot_ly Sankey example with vertical orientation and compare hover labels across the drawing area. Trace the Sankey flow hover-label positioning entry point and verify that labels remain aligned with their flows, including links on the right; add or run a regression check if the relevant test location is found.
Written by the indexing model from the issue text.
Assessment
- Tech stack
- plotly, r
- Domain
- data-visualization
- Issue type
- Bug
- Difficulty
- 4/5
- Estimated time
- 3-5 days
- Activity status
- Stale
- Clarity
- Mostly clear
- Newbie friendliness
- 35/100