Incorrect behavior of dynamicTicks vs autorange in facet mode
还没有人认领这个 Issue。
- 主要语言
- R
- 星标
- 2.7k
- 派生
- 641
- PR 合并指标
- 30 天内没有已合并 PR
描述
Hello!
I want to use dynamic ticks for plots in application. With that, need not to limit the plot by x axis (i want some spaces on the borders). I do that by "autorange = FALSE" in layot. For single plot it's work fine, but for facet_wrap or facet_grid plots it works fine only for the first plot (left). I tried to use xlim, coord_cartesian with xlim, scale_x_continuous. Nothing helps.
Plots are created using ggplot2 (ver. 3.1.0) and then rendered using ggplotly (plotly ver. 4.8.0).
My code:
library(data.table)
library(plotly)
library(ggplot2)

a1 <- c(1:50)
b1 <- rnorm(50, 30, 10)
c1 <- c(rep(c("abc","def"),25))
dt <- as.data.table(list("valueX" = a1, "valueY" = b1, "facetCol" = c1))
dt$facetCol <- as.factor(dt$facetCol)

pplot <- ggplot() + geom_line(data = dt, aes(x = valueX, y = valueY)) +
                    facet_wrap(~dt$facetCol, ncol = 2)
ggplotly(dynamicTicks = TRUE, pplot) %>% layout(xaxis = list(autorange = FALSE))
How i see it:
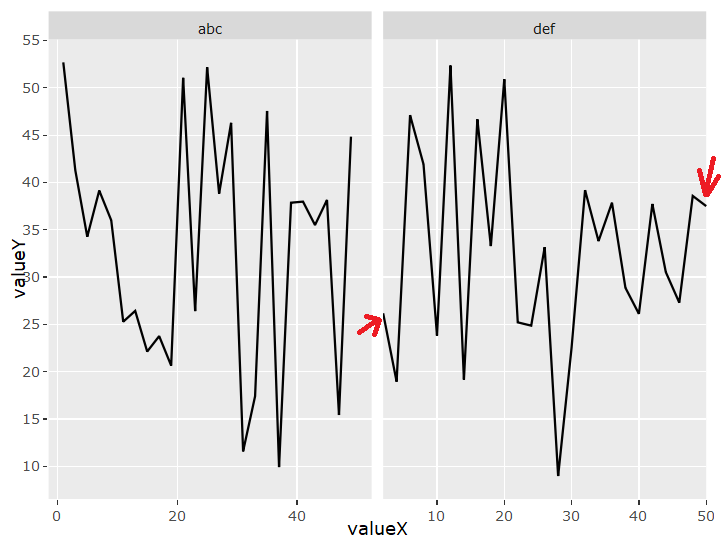
What i want:

贡献指南
从这里开始
- 先读完整个 Issue,再读项目的贡献指南。
- 在 Issue 下留言说明你要接手 —— 这能避免两个人做同样的事。
- Fork 仓库,在一个分支上完成修改。
- 提交 Pull Request,并在描述里引用这个 Issue 编号。
调研方向
首先使用 ggplot2 3.1.0 和 plotly 4.8.0 运行提供的 R 复现,比较单图和 facet_wrap 的输出。检查 ggplotly 如何转换 facet 轴以及 layout(xaxis = list(autorange = FALSE)) 设置;完成的标准是 autorange 在所有 facet 中都被一致禁用,并且动态刻度和所请求的边框间距在所有 facet 中都能正常工作。
由索引模型根据 Issue 内容生成。
评估
- 技术栈
- r
- 领域
- data-visualization
- Issue 类型
- 缺陷
- 难度
- 4/5
- 预计耗时
- 3-5 天
- 活跃度
- 停滞
- 描述清晰度
- 基本清楚
- 新手友好度
- 35/100