Incorrect behavior of dynamicTicks vs autorange in facet mode
Nessuno ha ancora preso questa issue.
- Lingua principale
- R
- Stelle
- 2.7k
- Fork
- 641
- Metriche di merge delle PR
- Nessuna PR unita negli ultimi 30g
Descrizione
Hello!
I want to use dynamic ticks for plots in application. With that, need not to limit the plot by x axis (i want some spaces on the borders). I do that by "autorange = FALSE" in layot. For single plot it's work fine, but for facet_wrap or facet_grid plots it works fine only for the first plot (left). I tried to use xlim, coord_cartesian with xlim, scale_x_continuous. Nothing helps.
Plots are created using ggplot2 (ver. 3.1.0) and then rendered using ggplotly (plotly ver. 4.8.0).
My code:
library(data.table)
library(plotly)
library(ggplot2)

a1 <- c(1:50)
b1 <- rnorm(50, 30, 10)
c1 <- c(rep(c("abc","def"),25))
dt <- as.data.table(list("valueX" = a1, "valueY" = b1, "facetCol" = c1))
dt$facetCol <- as.factor(dt$facetCol)

pplot <- ggplot() + geom_line(data = dt, aes(x = valueX, y = valueY)) +
                    facet_wrap(~dt$facetCol, ncol = 2)
ggplotly(dynamicTicks = TRUE, pplot) %>% layout(xaxis = list(autorange = FALSE))
How i see it:
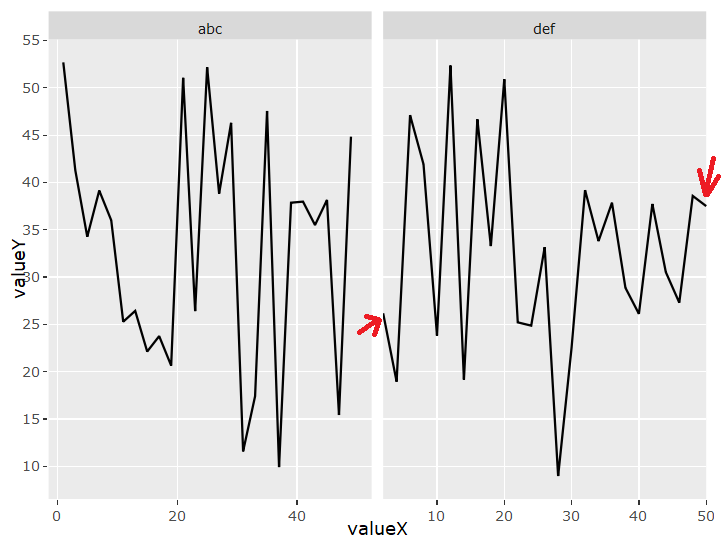
What i want:

Guida per i contributori
Apri la guida per i contributori
Come iniziare
- Leggi tutta la issue e poi la guida ai contributi del progetto.
- Commenta sulla issue per dire che te ne occupi tu — evita che due persone facciano lo stesso lavoro.
- Fai un fork del repository e lavora su un branch.
- Apri una pull request che faccia riferimento al numero della issue.
Direzione di ricerca
Inizia eseguendo la riproduzione R fornita con ggplot2 3.1.0 e plotly 4.8.0, confrontando gli output del grafico singolo e di facet_wrap. Esamina come ggplotly traduce gli assi delle facet e l’impostazione layout(xaxis = list(autorange = FALSE)); il lavoro è completato quando autorange è disabilitato in modo coerente su tutte le facet e i tick dinamici e la spaziatura del bordo richiesta funzionano su tutte le facet.
Scritto dal modello di indicizzazione a partire dal testo della issue.
Valutazione
- Stack tecnologico
- r
- Ambito
- data-visualization
- Tipo di issue
- Bug
- Difficoltà
- 4/5
- Tempo stimato
- 3-5 giorni
- Stato di attività
- Ferma
- Chiarezza
- Abbastanza chiara
- Idoneità per principianti
- 35/100