Incorrect behavior of dynamicTicks vs autorange in facet mode
Dieses Issue hat noch niemand übernommen.
- Vorherrschende Sprache
- R
- Sterne
- 2.7k
- Forks
- 641
- PR-Merge-Kennzahlen
- Keine gemergten PRs in 30 T.
Beschreibung
Hello!
I want to use dynamic ticks for plots in application. With that, need not to limit the plot by x axis (i want some spaces on the borders). I do that by "autorange = FALSE" in layot. For single plot it's work fine, but for facet_wrap or facet_grid plots it works fine only for the first plot (left). I tried to use xlim, coord_cartesian with xlim, scale_x_continuous. Nothing helps.
Plots are created using ggplot2 (ver. 3.1.0) and then rendered using ggplotly (plotly ver. 4.8.0).
My code:
library(data.table)
library(plotly)
library(ggplot2)

a1 <- c(1:50)
b1 <- rnorm(50, 30, 10)
c1 <- c(rep(c("abc","def"),25))
dt <- as.data.table(list("valueX" = a1, "valueY" = b1, "facetCol" = c1))
dt$facetCol <- as.factor(dt$facetCol)

pplot <- ggplot() + geom_line(data = dt, aes(x = valueX, y = valueY)) +
                    facet_wrap(~dt$facetCol, ncol = 2)
ggplotly(dynamicTicks = TRUE, pplot) %>% layout(xaxis = list(autorange = FALSE))
How i see it:
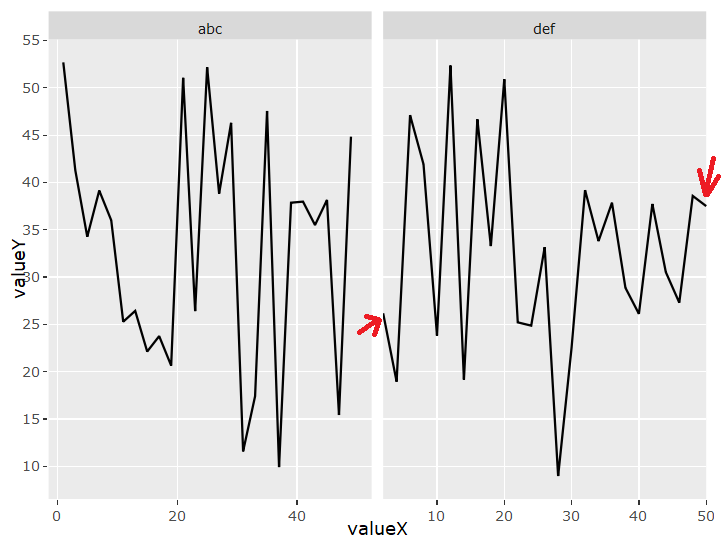
What i want:

Beitragsleitfaden
Erste Schritte
- Lies das ganze Issue und danach den Beitragsleitfaden des Projekts.
- Schreib ins Issue, dass du es übernimmst — das erspart doppelte Arbeit.
- Forke das Repository und arbeite in einem Branch.
- Öffne einen Pull Request, der die Issue-Nummer nennt.
Rechercherichtung
Beginne damit, die bereitgestellte R-Reproduktion mit ggplot2 3.1.0 und plotly 4.8.0 auszuführen und die Ausgaben von Einzelplot und facet_wrap zu vergleichen. Untersuche, wie ggplotly die Facet-Achsen und die Einstellung layout(xaxis = list(autorange = FALSE)) übersetzt; abgeschlossen ist die Aufgabe, wenn autorange in allen Facets konsistent deaktiviert ist und dynamische Ticks sowie der angeforderte Randabstand über alle Facets hinweg funktionieren.
Vom Indexierungsmodell aus dem Issue-Text verfasst.
Bewertung
- Tech-Stack
- r
- Bereich
- data-visualization
- Issue-Typ
- Bug
- Schwierigkeit
- 4/5
- Geschätzter Aufwand
- 3-5 Tage
- Aktivitätsstatus
- Veraltet
- Klarheit
- Größtenteils klar
- Anfängerfreundlichkeit
- 35/100