Quantile lines on violin plots are not rendered
Dieses Issue hat noch niemand übernommen.
- Vorherrschende Sprache
- R
- Sterne
- 2.7k
- Forks
- 641
- PR-Merge-Kennzahlen
- Keine gemergten PRs in 30 T.
Beschreibung
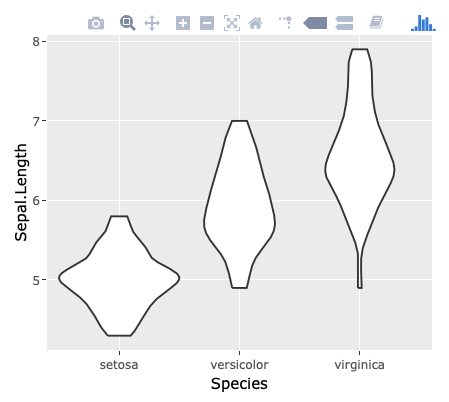
When using draw_quantiles argument of ggplot2::geom_violin and converting the result with plotly::ggplotly, the quantile lines are shown on ggplot but not on plotly.
library(ggplot2)
library(plotly)
#>
#> Attaching package: 'plotly'
#> The following object is masked from 'package:ggplot2':
#>
#>     last_plot
#> The following object is masked from 'package:stats':
#>
#>     filter
#> The following object is masked from 'package:graphics':
#>
#>     layout

g <- ggplot(iris, aes(Species, Sepal.Length)) +
  geom_violin(draw_quantiles = c(0.25, 0.5, 0.75))
g

# ggplotly(g)
Created on 2018-11-12 by the reprex package (v0.2.1)
I'm not able to provided the result of ggplotly above. Still, by executing ggplotly(g) above, you'll find that the quantile lines disappear:
Beitragsleitfaden
Erste Schritte
- Lies das ganze Issue und danach den Beitragsleitfaden des Projekts.
- Schreib ins Issue, dass du es übernimmst — das erspart doppelte Arbeit.
- Forke das Repository und arbeite in einem Branch.
- Öffne einen Pull Request, der die Issue-Nummer nennt.
Rechercherichtung
Reproduzieren Sie das Problem mit dem bereitgestellten R-Beispiel unter Verwendung von ggplot2::geom_violin(draw_quantiles = c(0.25, 0.5, 0.75)) und plotly::ggplotly. Verfolgen Sie nach, wie Violinenschichten und ihre Quantillinien konvertiert werden, und überprüfen Sie anschließend, dass die Quantillinien im konvertierten Plot so erscheinen wie in ggplot.
Vom Indexierungsmodell aus dem Issue-Text verfasst.
Bewertung
- Tech-Stack
- r
- Bereich
- data-visualization
- Issue-Typ
- Bug
- Schwierigkeit
- 3/5
- Geschätzter Aufwand
- 1-2 Tage
- Aktivitätsstatus
- Veraltet
- Klarheit
- Klar beschrieben
- Anfängerfreundlichkeit
- 45/100