geom_line becomes invisible when color aesthetic applied
オープン
まだ誰も着手していません。
ggplotly
plotly.js
- 主要言語
- R
- スター
- 2.7k
- フォーク
- 641
- PR マージ指標
- 30日以内にマージされた PR はありません
説明
I am attempting to apply a gradient color scale to a line in a ggplot object. When I create the plotly chart, the plotted line is not visible. Hovering over the plot area shows the values of the variables if the cursor is where the line is located, even though the line is not visible.
If I do not apply a color aesthetic, the line is visible.
I have download the most recent plotly package from Github.
Here is some example code of the issue:
library(tidyverse)

df <- tibble(
x = rnorm(100, 7, 1),
y = rnorm(100, 4, 1),
z = rnorm(100, 5, 1))

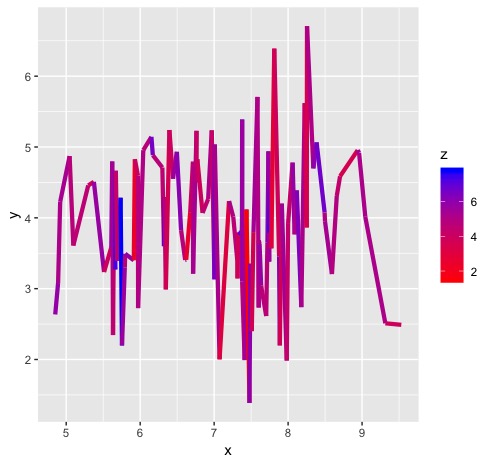
plot <- ggplot(df) +
geom_line(aes(x, y, color = z),
lwd = 1.5) +
scale_color_gradient(low = "red",
high = "blue")

plot

plotly::plotly_build(plot)
ggplot:

コントリビューションガイド
はじめの一歩
- issue を最後まで読み、次にプロジェクトのコントリビューションガイドを読みます。
- 着手することを issue にコメントします — 二人が同じ作業をするのを防げます。
- リポジトリをフォークし、ブランチを切って変更します。
- issue 番号を参照したプルリクエストを送ります。
調査の方向性
まず、ggplot2、geom_line()、scale_color_gradient()、および plotly::plotly_build(plot) を使って issue の R 例を実行し、color aesthetic を使わないバージョンと比較します。色付きの ggplot の線が Plotly チャートに変換される過程を追跡します。線が表示され、グラデーションカラーとホバー時の値が維持されていれば完了です。
索引モデルが issue の本文から書いたものです。
評価
- 技術スタック
- r
- 領域
- data-visualization
- issue の種類
- バグ
- 難易度
- 3/5
- 見積もり時間
- 1〜2日
- 活発さ
- 停滞
- 明瞭さ
- おおむね明確
- 初心者へのやさしさ
- 38/100