geom_line becomes invisible when color aesthetic applied
Dieses Issue hat noch niemand übernommen.
- Vorherrschende Sprache
- R
- Sterne
- 2.7k
- Forks
- 641
- PR-Merge-Kennzahlen
- Keine gemergten PRs in 30 T.
Beschreibung
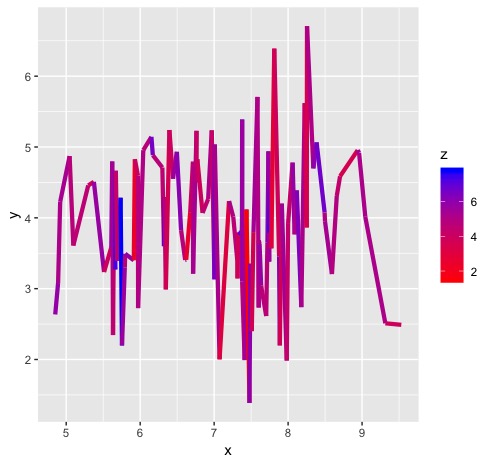
I am attempting to apply a gradient color scale to a line in a ggplot object. When I create the plotly chart, the plotted line is not visible. Hovering over the plot area shows the values of the variables if the cursor is where the line is located, even though the line is not visible.
If I do not apply a color aesthetic, the line is visible.
I have download the most recent plotly package from Github.
Here is some example code of the issue:
library(tidyverse)

df <- tibble(
x = rnorm(100, 7, 1),
y = rnorm(100, 4, 1),
z = rnorm(100, 5, 1))

plot <- ggplot(df) +
geom_line(aes(x, y, color = z),
lwd = 1.5) +
scale_color_gradient(low = "red",
high = "blue")

plot

plotly::plotly_build(plot)
ggplot:

Beitragsleitfaden
Erste Schritte
- Lies das ganze Issue und danach den Beitragsleitfaden des Projekts.
- Schreib ins Issue, dass du es übernimmst — das erspart doppelte Arbeit.
- Forke das Repository und arbeite in einem Branch.
- Öffne einen Pull Request, der die Issue-Nummer nennt.
Rechercherichtung
Beginne damit, das R-Beispiel des Issues mit ggplot2, geom_line(), scale_color_gradient() und plotly::plotly_build(plot) auszuführen, und vergleiche es mit der Version ohne eine Farbästhetik. Verfolge die Konvertierung der farbigen ggplot-Linie in den Plotly-Chart; als erledigt gilt es, wenn die Linie sichtbar ist und dabei ihre Verlaufsfarben und Hover-Werte beibehält.
Vom Indexierungsmodell aus dem Issue-Text verfasst.
Bewertung
- Tech-Stack
- r
- Bereich
- data-visualization
- Issue-Typ
- Bug
- Schwierigkeit
- 3/5
- Geschätzter Aufwand
- 1-2 Tage
- Aktivitätsstatus
- Veraltet
- Klarheit
- Größtenteils klar
- Anfängerfreundlichkeit
- 38/100