geom_line becomes invisible when color aesthetic applied
未关闭
还没有人认领这个 Issue。
ggplotly
plotly.js
- 主要语言
- R
- 星标
- 2.7k
- 派生
- 641
- PR 合并指标
- 30 天内没有已合并 PR
描述
I am attempting to apply a gradient color scale to a line in a ggplot object. When I create the plotly chart, the plotted line is not visible. Hovering over the plot area shows the values of the variables if the cursor is where the line is located, even though the line is not visible.
If I do not apply a color aesthetic, the line is visible.
I have download the most recent plotly package from Github.
Here is some example code of the issue:
library(tidyverse)

df <- tibble(
x = rnorm(100, 7, 1),
y = rnorm(100, 4, 1),
z = rnorm(100, 5, 1))

plot <- ggplot(df) +
geom_line(aes(x, y, color = z),
lwd = 1.5) +
scale_color_gradient(low = "red",
high = "blue")

plot

plotly::plotly_build(plot)
ggplot:
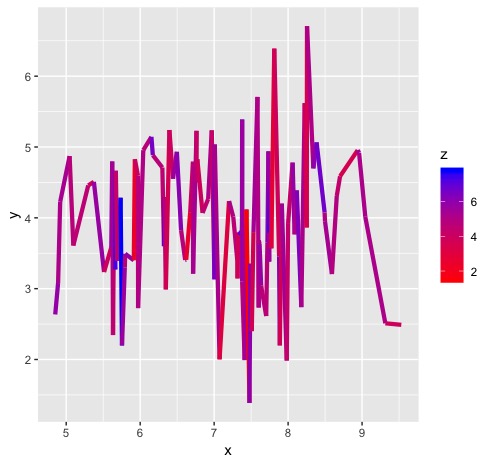

贡献指南
从这里开始
- 先读完整个 Issue,再读项目的贡献指南。
- 在 Issue 下留言说明你要接手 —— 这能避免两个人做同样的事。
- Fork 仓库,在一个分支上完成修改。
- 提交 Pull Request,并在描述里引用这个 Issue 编号。
调研方向
首先使用 ggplot2、geom_line()、scale_color_gradient() 和 plotly::plotly_build(plot) 运行 issue 中的 R 示例,并将其与不使用颜色美学映射的版本进行比较。跟踪有颜色的 ggplot 线转换为 Plotly 图表的过程;当线条可见且保留其渐变色和悬停值时,即表示完成。
由索引模型根据 Issue 内容生成。
评估
- 技术栈
- r
- 领域
- data-visualization
- Issue 类型
- 缺陷
- 难度
- 3/5
- 预计耗时
- 1-2 天
- 活跃度
- 停滞
- 描述清晰度
- 基本清楚
- 新手友好度
- 38/100