Table cell misalignment and table getting wider when moving the mouse over it with flex layout
未关闭
还没有人认领这个 Issue。
bug
dash-data-table
P3
- 主要语言
- Python
- 星标
- 24.4k
- 派生
- 2.3k
- 平均合并
- 2 天 7 小时
- 30 天内合并 PR
- 13
描述
Describe your context
Here's my setup:
python --version
Python 3.7.5

conda list dash
# Name                    Version
dash                      1.4.1
dash-core-components      1.3.1
dash-html-components      1.0.1
dash-renderer             1.1.2
dash-table                4.4.1
- OS: Windows 7
- Browsers:
- Chrome 77.0.3865.75
- IE 11.0.9600.19504
Describe the bug
Consider there following piece of code:
import os

import dash
import dash_html_components as html
import dash_table
import pandas as pd

df = pd.read_csv('https://raw.githubusercontent.com/plotly/datasets/master/solar.csv')

app = dash.Dash(__name__)

app.layout = html.Div(
    children=[
        dash_table.DataTable(
            id='table',
            columns=[{'name': c, 'id': c} for c in df.columns],
            fixed_rows=dict(headers=True, data=0),
            data=df.to_dict('records')
        )
    ],
    className='eight columns',
    style={'display': 'flex', 'justify-content': 'center'})

if __name__ == '__main__':
    app.run_server(debug=True)
Now we have two problems:
- The browser renders the table with a misalignment between header and the rest of the table, see screenshots below
- When I start moving my mouse over the table then every time the mouse pointer crosses any of the cell boundaries then the table gets a few pixels wider (in Chrome) or smaller (in IE), see screenshots below.
Expected behavior
- There should be no misalignment between header and the rest of the table
- The mouse moving over the table should have no effect whatsoever.
Screenshots
Initial state in Chrome:

After having moved the mouse over the table for a bit:
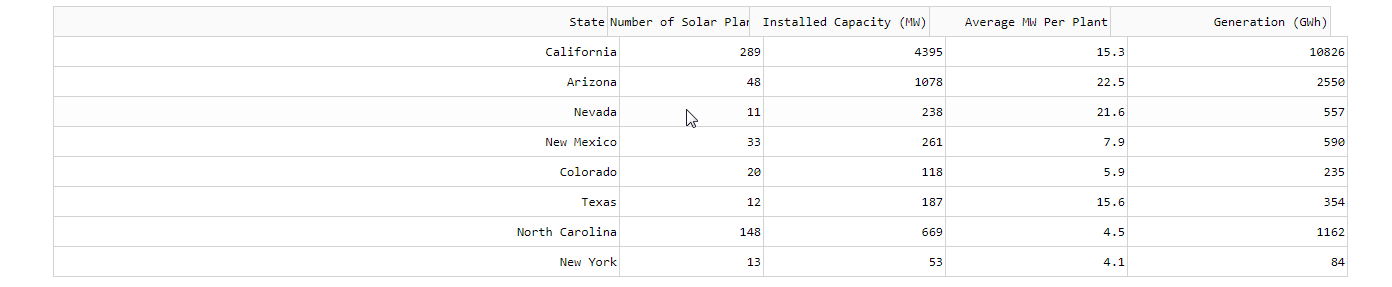
Initial state in IE:

After having moved the mouse over the table for a bit:

贡献指南
从这里开始
- 先读完整个 Issue,再读项目的贡献指南。
- 在 Issue 下留言说明你要接手 —— 这能避免两个人做同样的事。
- Fork 仓库,在一个分支上完成修改。
- 提交 Pull Request,并在描述里引用这个 Issue 编号。
调研方向
使用提供的 Python Dash DataTable 示例,采用 flex 布局和固定表头行重现该问题。在 Chrome 和 IE 中将指针移过单元格边界时,检查表头/表体对齐情况和表格宽度。完成的标准是表头保持对齐,并且鼠标移动不再改变表格宽度。
由索引模型根据 Issue 内容生成。
评估
- 技术栈
- python
- 领域
- frontend
- Issue 类型
- 缺陷
- 难度
- 3/5
- 预计耗时
- 1-2 天
- 活跃度
- 停滞
- 描述清晰度
- 基本清楚
- 新手友好度
- 35/100