Dumbbell plot
未关闭
还没有人认领这个 Issue。
Difficulty: Beginner
FsLab Hackathon 2023
- 主要语言
- F#
- 星标
- 860
- 派生
- 99
- 平均合并
- 22 分钟
- 30 天内合并 PR
- 1
描述
Description
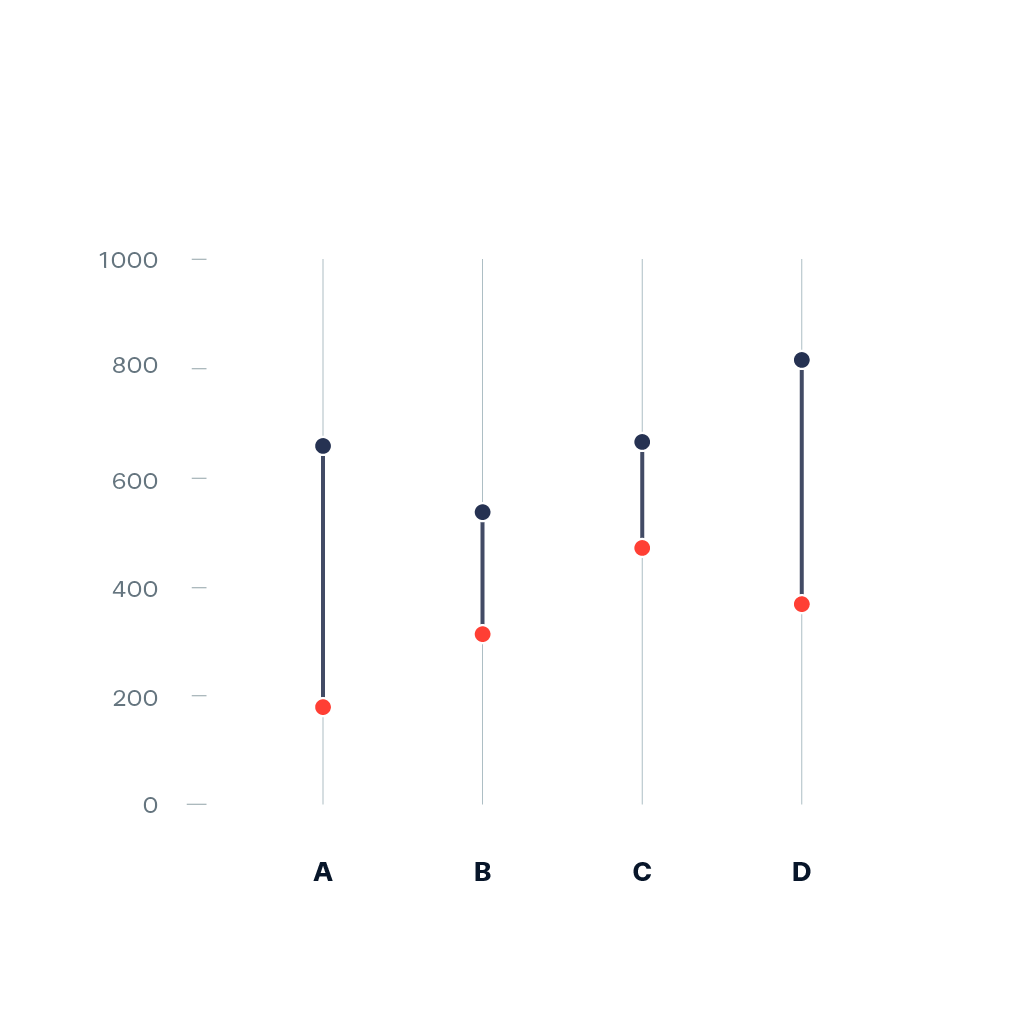
Dumbbell plot [1] (also known as Dumbbell chart, Connected dot plot) is great for displaying changes between two points in time, two conditions or differences between two groups.
Example:
Pointers
- Ideally, you start prototyping in a scripting or notebook environment where you can iterate fast. installation instructions can be found here: https://plotly.net/#Installation
- Charts like this that are using baseline trace types to create a new chart type should only be implemented in the top-level Chart API. An example where this is already done is the Range chart that combines a set of differently styled line charts.
- When possible, use
#IConvertiblefor data input, as this allows forstrings, number types such asintandfloat, andDateTime.
References
Hints (click to expand if you need additional pointers)
- The most suitable base chart for this is a set of line charts that each connect the two data points by a line
- The high-level function should look quite similar to the base implementation of
Chart.Range
贡献指南
这个仓库没有索引到贡献指南
从这里开始
- 先读完整个 Issue,再读项目的贡献指南。
- 在 Issue 下留言说明你要接手 —— 这能避免两个人做同样的事。
- Fork 仓库,在一个分支上完成修改。
- 提交 Pull Request,并在描述里引用这个 Issue 编号。
调研方向
从 src/Plotly.NET/ChartAPI/Chart2D.fs 开始,重点查看 issue 中引用的 Chart.Range 实现。按照 Plotly.NET 的安装说明,在脚本或 notebook 环境中制作图表原型,并检查基线折线图是如何组合的。当提供支持灵活 #IConvertible 输入的高级 Dumbbell 图表 API,并显示 issue 中描述的两点连接时,即视为完成。
由索引模型根据 Issue 内容生成。
评估
- 技术栈
- fsharp
- 领域
- data-visualization
- Issue 类型
- 功能
- 难度
- 3/5
- 预计耗时
- 1-2 天
- 活跃度
- 停滞
- 描述清晰度
- 基本清楚
- 新手友好度
- 38/100