Dumbbell plot
Dieses Issue hat noch niemand übernommen.
- Vorherrschende Sprache
- F#
- Sterne
- 860
- Forks
- 99
- Ø Merge
- 22 Min.
- Gemergte PRs (30 T.)
- 1
Beschreibung
Description
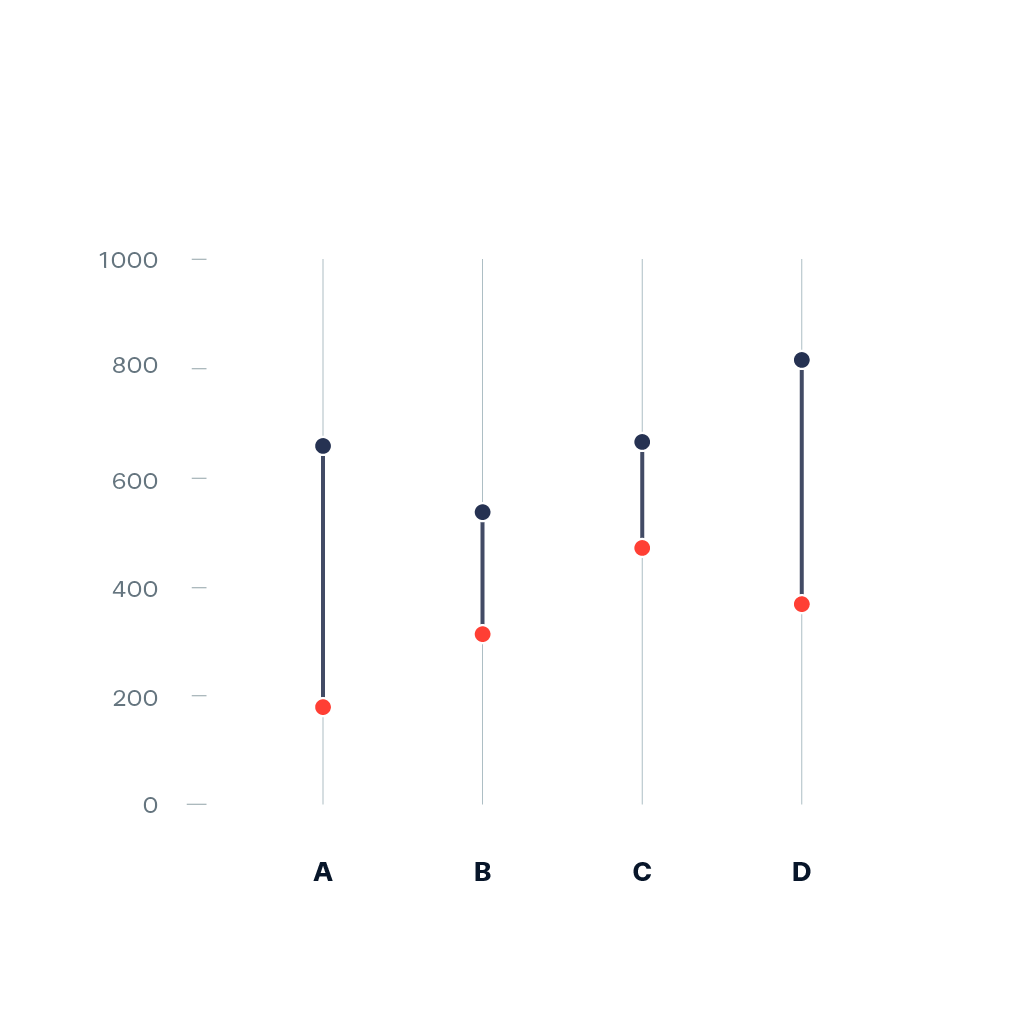
Dumbbell plot [1] (also known as Dumbbell chart, Connected dot plot) is great for displaying changes between two points in time, two conditions or differences between two groups.
Example:
Pointers
- Ideally, you start prototyping in a scripting or notebook environment where you can iterate fast. installation instructions can be found here: https://plotly.net/#Installation
- Charts like this that are using baseline trace types to create a new chart type should only be implemented in the top-level Chart API. An example where this is already done is the Range chart that combines a set of differently styled line charts.
- When possible, use
#IConvertiblefor data input, as this allows forstrings, number types such asintandfloat, andDateTime.
References
Hints (click to expand if you need additional pointers)
- The most suitable base chart for this is a set of line charts that each connect the two data points by a line
- The high-level function should look quite similar to the base implementation of
Chart.Range
Beitragsleitfaden
Für dieses Repository ist kein Beitragsleitfaden indexiert
Erste Schritte
- Lies das ganze Issue und danach den Beitragsleitfaden des Projekts.
- Schreib ins Issue, dass du es übernimmst — das erspart doppelte Arbeit.
- Forke das Repository und arbeite in einem Branch.
- Öffne einen Pull Request, der die Issue-Nummer nennt.
Rechercherichtung
Beginne in src/Plotly.NET/ChartAPI/Chart2D.fs, insbesondere bei der im Issue referenzierten Chart.Range-Implementierung. Prototypisiere das Diagramm in einer Skript- oder Notebook-Umgebung anhand der Plotly.NET-Installationsanweisungen und prüfe, wie Baseline-Liniendiagramme kombiniert werden. Als erledigt gilt dies, wenn eine High-Level-Dumbbell-Chart-API mit flexiblen #IConvertible-Eingaben verfügbar ist und die im Issue beschriebenen Verbindungen zwischen zwei Punkten darstellt.
Vom Indexierungsmodell aus dem Issue-Text verfasst.
Bewertung
- Tech-Stack
- fsharp
- Bereich
- data-visualization
- Issue-Typ
- Feature
- Schwierigkeit
- 3/5
- Geschätzter Aufwand
- 1-2 Tage
- Aktivitätsstatus
- Veraltet
- Klarheit
- Größtenteils klar
- Anfängerfreundlichkeit
- 38/100