Lollipop chart
オープン
まだ誰も着手していません。
Area: Core API
Type: Enhancement
- 主要言語
- F#
- スター
- 860
- フォーク
- 99
- 平均マージ
- 22分
- マージ済み PR(30日)
- 1
説明
Description
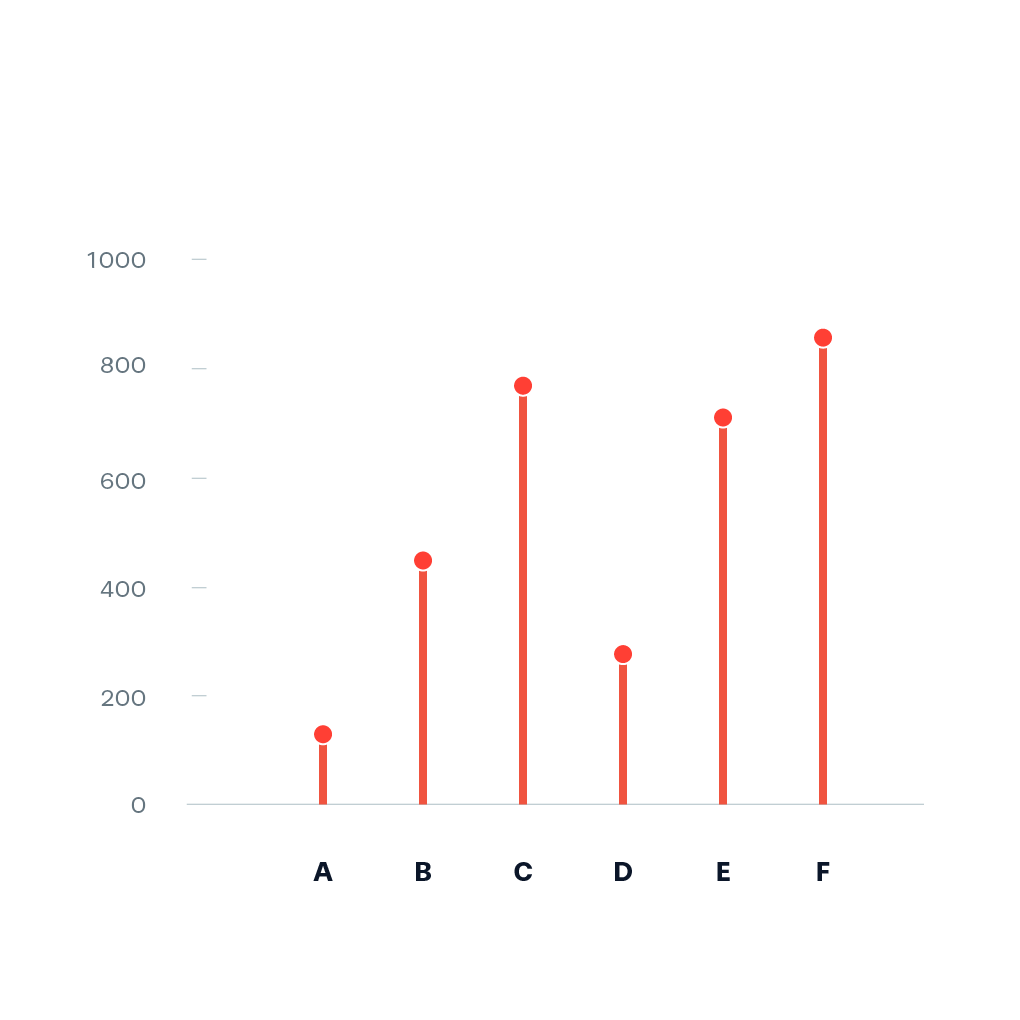
A Lollipop chart is a categorical chart that is basically a bar chart replaced by points being connected by a line to the zero-line of the reference axis representing the data. It can be helpful to reduce visual noise when all values have a similar height [1].
Example:
Pointers
- Ideally, you start prototyping in a scripting or notebook environment where you can iterate fast. installation instructions can be found here: https://plotly.net/#Installation
- Charts like this that are using baseline trace types to create a new chart type should only be implemented in the top-level Chart API. An example where this is already done is the Range chart that combines a set of differently styled line charts.
- When possible, use
#IConvertiblefor data input, as this allows forstrings, number types such asintandfloat, andDateTime.
References
Hints (click to expand if you need additional pointers)
- The most suitable base chart for this is a set of line charts that each connect the zero line to a data point
- The high-level function should look quite similar to the base implementation of
Chart.Bar
コントリビューションガイド
このリポジトリのコントリビューションガイドは索引されていません
はじめの一歩
- issue を最後まで読み、次にプロジェクトのコントリビューションガイドを読みます。
- 着手することを issue にコメントします — 二人が同じ作業をするのを防げます。
- リポジトリをフォークし、ブランチを切って変更します。
- issue 番号を参照したプルリクエストを送ります。
調査の方向性
src/Plotly.NET/ChartAPI/Chart2D.fs から始め、既存の Range chart と Chart.Bar の実装を読みます。スクリプトまたは notebook 環境で、ゼロから各データポイントまでをつないだ折れ線グラフを使用してプロトタイプを作成します。ライブラリの既存のチャートパターンに従い、#IConvertible をサポートするデータ入力を備えたトップレベルのロリポップチャート API があれば完了です。
索引モデルが issue の本文から書いたものです。
評価
- 技術スタック
- fsharp
- 領域
- data-visualization
- issue の種類
- 機能追加
- 難易度
- 3/5
- 見積もり時間
- 1〜2日
- 活発さ
- 停滞
- 明瞭さ
- 明確に書かれている
- 初心者へのやさしさ
- 48/100